
 View Cart
 sales@dataq.com
 330-668-1444
Clutch Testing with Data Acquisition Products
 Our customer, a manufacturer of clutches used in a variety of small and large vehicle applications, wanted to replace his aging test instrumentation. Consisting of a 20-year old Gould Mark 200 chart recorder and associated amplifiers, the old equipment was breaking down frequently, difficult to repair, and expensive to maintain with paper, pens and ink that were becoming almost impossible to purchase. The customer had requested one of our Starter Kits, was impressed with WinDaq's chart recorder-like characteristics, and saw our products as a contemporary, yet seamless replacement for his aging instruments.
The application called for six different measurements. Ultimately, the customer chose a DI-730 data acquisition instrument with a DI-75B backpack populated with four 5B-style signal conditioners. Here's how the signals are allocated:
| Physical Measurement | Source | Range | Connection |
| Torque | Lebow torque transducer | 2mv/v, 10,000 in-lbs. | DI-75B via DI-5B38-05 strain module |
| Oil flow | Cox turbine flowmeter | 500Hz max | DI-75B via DI-5B45-01 frequency module |
| Oil pressure | Dynisco pressure transducer | 1.5mv/v, 500psi | DI-75B via DI-5B38-05 strain module |
| Temperature | K-type thermocouple | 100 °C | DI-75B via DI-5B47K-05 thermocouple module |
| Flywheel rpm | Generator | 2000 rpm, 30V | Direct-connect to DI-730 channel |
| Motor rpm | Generator | 2000 rpm, 30V | Direct-connect to DI-730 channel |
The above configuration yielded the advantage that each channel was electrically isolated from the others. Since the machine that performs the tests was large and driven by a 440V AC motor, "electrical ground" was a relative term. As such, there was a very high probability of common mode voltages that could disrupt signal quality at best, or destroy an instrument's front-end at worst. The isolation properties of the 5B modules and DI-730 channels guarantee accurate measurements and eliminate any possibility of damage to the instruments.
Clutch testing in this application is a particularly dynamic and repetitive process. The following general procedure applies:
- The AC motor shaft is connected to a clutch that is initially disengaged from the pressure plate. The motor is activated and maintained at a constant speed of 2,000 rpm.
- While it's rotating at 2,000 rpm, the clutch, loaded by a massive, initially static flywheel, is engaged using a hydraulic mechanism. This transfer of energy is measured until the flywheel approaches the initial motor speed of 2,000 rpm.
- The clutch is disengaged, and the flywheel is braked until it stops rotating.
- Steps 1-3 are repeated for the prescribed number of cycles, which could number into the hundreds.
During the testing process, various parameters are measured by the data acquisition system, as described.
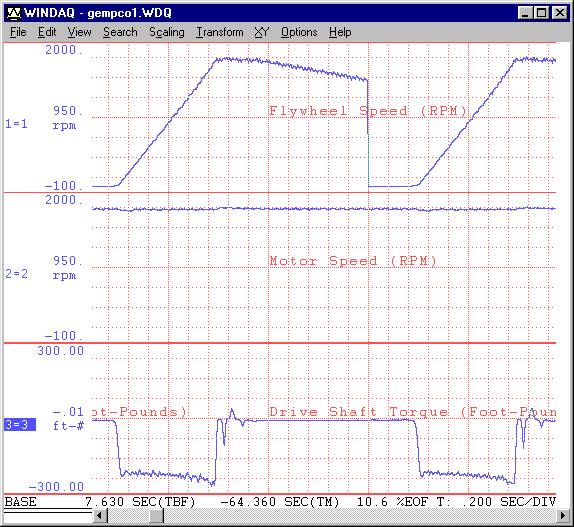
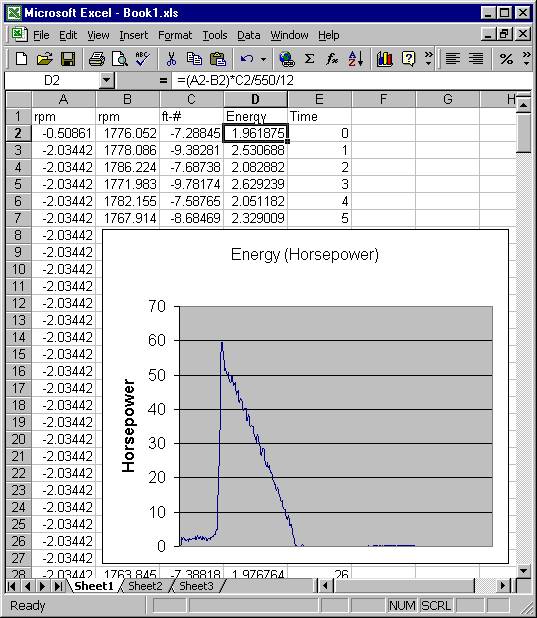
Shown here are three of the six acquired channels that represent two consecutive test cycles. Note that WinDaq is placed in its Triggered Mode and adjusted to acquire 50 pre-trigger, and 250 post trigger samples. The WinDaq Trigger Mode eliminates extraneous data between cycles. The trigger channel is Flywheel rpm.An interesting feature of this application was the need to generate an energy waveform in real time. This calculated channel becomes the focal point of the test since its wave shape determines when the clutch has failed. DATAQ Instruments applications engineers suggested the use of WinDaq/XL to generate the calculated channel from within Microsoft Excel in real time. WinDaq/XL is bridging software that runs from within Excel, and allows data acquired by WinDaq/Lite, /Pro, or /Pro+ software to be ported into Excel cells in real time. You actually see two windows on your screen at the same time: The WinDaq real time graphical display, and Excel. Both share the same data. With the data in Excel, all the calculation power of that application can be brought to bear on WinDaq-acquired data to yield the desired calculated result in real time. In this instance, the column labeled ENERGY was calculated as a function of the following equation:(flywheel rpm - motor rpm) × torque. The result is displayed in horsepower from within Excel both numerically, and graphically in real time.
The chart recorder and associated amplifiers cost our customer well over $45,000. One roll of paper cost $150. One pen cost $99. The entire system, including amplifiers, consumed the space of a large desk. Twenty years later, we replaced this system with one about the size of a child's lunchbox, for less than $5,000. Oh, how times have changed!