The Fact, Folly and Mathematics of Analog to Digital Converter Resolution
Everyone agrees that higher resolution analog to digital converters (ADCs) are better, right? So why do so many end-users shell out bucks for one and then fail to exploit that advantage? What I mean is that we are too often shocked when we receive data files from customers with data acquisition parameters set in a manner that throws ADC resolution under the bus. An example might help, and here's just one of many (the customer will forever remain nameless):
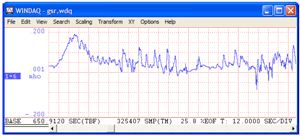
Figure 1 — Channel data as typically viewed by the customer appears fine. (click image to enlarge)
Figure 1 is a screenshot of WinDaq-acquired data as viewed from WinDaq Playback software. The waveform was acquired with a 14-bit ADC. Looks okay, right? Ah, but I have you at a disadvantage. The customer has vertically scaled the trace to provide only the illusion that all is well. In fact, this channel was acquired in a manner that we affectionately call "in the mud."
Taking advantage of a cool WinDaq feature called Show Dynamic Range (see Figure 2), I can force the selected channel to automatically scale itself to fit between the upper and lower limits of the ADC's measurement range to provide a visual picture of what the ADC sees as it digitizes the channel's data.
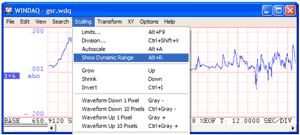
Figure 2 — Invoking WinDaq's Show Dynamic Range function tells the real story (click to enlarge.)
The result is Figure 3 where the trace virtually disappears, meaning that the ADC doesn't have much signal to work with (i.e. the signal is "in the mud").
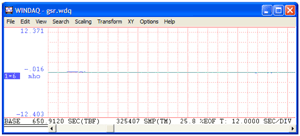
Figure 3 — This is what the ADC sees as exposed by WinDaq's Show Dynamic Range function. (click to enlarge)
So, what's the problem?
You can think of acquiring data at such a small percentage of the full-scale range as an effective reduction in ADC resolution and we can describe this reduction mathematically, essentially working backward to determine the effective bit resolution of the ADC.
We can start by defining an equation that relates ADC counts to the resolution of the ADC (assuming a bipolar range) and the ratio of the full-scale signal and ADC ranges in engineering units:

Equation 1 Where:
C = ADC counts applied to the measurement.
FS = Full-scale signal range in engineering units
FA = Full-scale ADC range in engineering units
n = ADC bit resolution
From Equation (1) we can see that if the full-scale range of the signal (FS) is less than the fullscale range of the ADC (FA), then ADC counts applied to the measurement are reduced by the ratio FS:FA. If FS is equal to FA then all ADC counts are applied to the measurement, the ideal case. In that situation, Equation (1) reduces to:
![]()
Equation 2
Next we can algebraically manipulate Equation (2) to solve for n, since we're interested in the effective bit resolution of the ADC in situations where FS < FA.
![]()
Equation 3
Equation (3) essentially turns the tables on the resolution question. Given a signal with excursions of only C ADC counts as calculated from Equation (1), Equation (3) describes the effective bit resolution of the ADC required to handle it.
Pulling it all together
Let's see how the math sorts out in the context of our customer's data file. We'll start by calculating C using Equation (1).
From WinDaq Playback software's Statistics function I can easily determine: FS = 0.171 mho
From Figure 3 I can see that WinDaq displays a full-scale dynamic range of: FA = 12.371 mho
We also know that the measurement was made using a 14-bit bipolar ADC. Now we have enough information to determine the total ADC counts of the measurement using Equation (1):
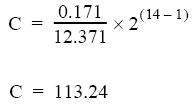
Now that we know total ADC counts we can use Equation (3) to determine the effective bit resolution of the ADC:
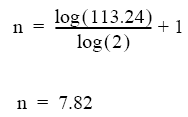
Now, I'm almost certain that if our customer had looked at our ADC data sheet before he purchased it and saw that its resolution was less than 8 bits, he would have moved promptly to a different vendor. Yet, by acquiring data in the manner he did that's all the resolution he's brought to bear on his measurement. And don't fall into the trap of thinking that he's suffered only a 44 percent penalty (14 to 7.84 bits). Remember that ADC counts is exponentially related to bit resolution. Our customer has in fact suffered over a 98 percent performance hit: 214 to 27.82, or 16384 to 226 ADC counts. Ouch!
Gain to the rescue
So how do you resolve this dilemma? The customer acquired our example data file at a gain factor of one, but the instrument he used to do it allows programmable gain factors of 10 and 100 to be applied as well. The application of gain factors greater than one has the affect of lowering the ADC's full-scale range, variable FA in Equation (1), by an amount equal to the reciprocal of the gain factor, times FA. Turing to our example calculations, if the customer had acquired the signal at a gain of 10 (a gain of 100 is too great and would make FS >FA), total ADC counts applied to the measurement would be:
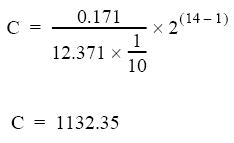
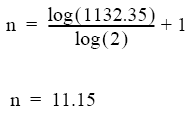
Applying a gain factor of 10 effectively increases ADC bit resolution from 7.82 to 11.15 bits. That's an improvement of nearly 900 percent in terms of all-important ADC counts.
Conclusions
The point of this application note was not to imply that you need to slug through equations before you can acquire data. Those were offered simply to put meat on the bones of the argument that signals acquired at a very low percentage of the ADC's full-scale range suffer a severe performance hit in terms of effective ADC bit resolution. Your rule-of-thumb take on this should be to ensure that the anticipated full-scale excursions of the signals you wish to acquire consume at least half of the ADC's full-scale range. If not, then take advantage of the gain facility that is built into most medium- to high-performance data acquisition hardware products.
Finally, for your convenience I've prepared Table (1) as a quick-look for the performance hit you'll suffer at various FS:FA ratios as a function of ADC resolution. Use it wisely.
| FS/FA | Native ADC Resolutions | Performance Hit (%) | ||||
| 8-bit | 10-bit | 12-bit | 14-bit | 16-bit | ||
| Effective ADC Resolutions (ne) | ||||||
| 1.00 | 8.0 | 10.0 | 12.0 | 14.0 | 16.0 | 0 |
| 0.90 | 7.8 | 9.8 | 11.8 | 13.8 | 15.8 | 10 |
| 0.80 | 7.7 | 9.7 | 11.7 | 13.7 | 15.7 | 20 |
| 0.70 | 7.5 | 9.5 | 11.5 | 13.5 | 15.5 | 30 |
| 0.60 | 7.3 | 9.3 | 11.3 | 13.3 | 15.3 | 40 |
| 0.50 | 7.0 | 9.0 | 11.0 | 13.0 | 15.0 | 50 |
| 0.40 | 6.7 | 8.7 | 10.7 | 12.7 | 14.7 | 60 |
| 0.30 | 6.3 | 8.3 | 10.3 | 12.3 | 14.3 | 70 |
| 0.20 | 5.7 | 7.7 | 9.7 | 11.7 | 13.7 | 80 |
| 0.10 | 4.7 | 6.7 | 8.7 | 10.7 | 12.7 | 90 |
Table 1 - Performance hit measures the decrease in available ADC counts as a function of the peak signal to full-scale ADC range ratio.


 View Cart
 sales@dataq.com
 330-668-1444