
The Waveform Acquisition Window
The typical WinDaq Acquisition window consists of six fundamental components: the title bar, menu bar, status bar, left/right annotation margin, waveform strip area, and the bottom annotation line. These components are shown in the following illustration.
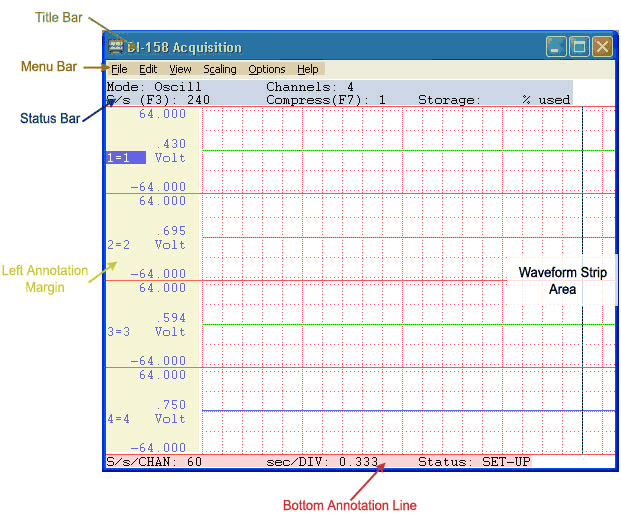
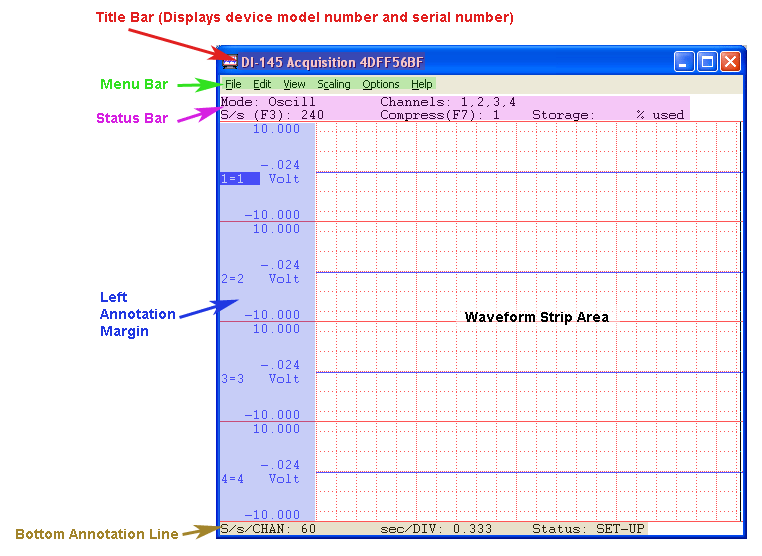
The title bar has two purposes: it identifies a file through the file name and it serves as a visual cue that the window may be moved or manipulated. The title bar consists of two parts: the window title and the window sizing icons.

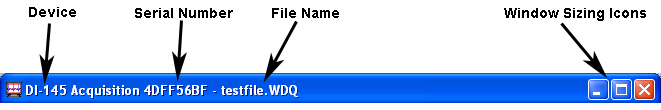
Window title
The window title
contains the WinDaq Acquisition utility name and the currently active
data storage file name.
Window sizing icons
The window sizing icons provide a fast, convenient way to reduce, enlarge, close, or return the window to its previous size. Selecting one of these icons with the mouse performs that action.
The commands available in WinDaq Acquisition are grouped in the menus. These menus appear in the bar across the top of the window and represent the heart of the WinDaq Acquisition package.
![]()
With these menus you can apply the powerful waveform acquisition capabilities of WinDaq Acquisition. To choose a command from a menu, you can either point to the desired menu and click, or press the ALT key and then the underlined letter of the desired menu. This causes the commands available on that menu to be “pulled down” or displayed. Once displayed, the commands on the pull-down menu can be chosen (and thus performed) by clicking on the desired command or by pressing the underlined letter in the desired command. Also provided on the pull-down menus are keyboard shortcuts or accelerators. Accelerators are function keys or combinations of keys displayed next to the menu item that when pressed, immediately invokes the desired action. This lets you bypass the pull-down menus and carry out commands directly from the keyboard, a time-saving feature when processing repetitive tasks. Refer to Command Hierarchy for a listing of accelerators.
When you choose a command that is followed by an ellipsis (…), WinDaq Acquisition displays a dialog box indicating that more information must be entered or an option must be selected before the command can be carried out.
Some command names occasionally appear dimmed. This indicates that the command does not apply to your device or to the current situation or that you may need to make a selection or complete an action before choosing the command.
The status bar has two purposes: to display the current status of acquisition parameters and to provide a fast, convenient, short-cut method for selecting display mode, sample rate, channels, and compression for modification.
The settings of all current acquisition parameters are shown here. Additionally, the progress of data storage to disk is shown in the Storage: % used field and the number of screen updates per second (how many times the display is redrawn) is shown in the Frames/s: field.
Double clicking on the Mode: field toggles the operating mode between scroll mode and oscilloscope mode (the same as choosing Options Scroll Mode or Options Oscilloscope Mode…). Double clicking on the S/s (F3): field displays the sample rate dialog box (the same as choosing Sample Rate… from the Edit menu or clicking the Sample Rate button in the Toolbox). Double clicking on the Channels: field displays the channels selection block cursor (just like selecting Edit Channels…). Double clicking on the Compress (F7): field displays the compression dialog box (similar to selecting Edit Compression…).
![]()
The left and/or right annotation margin has three purposes: it can be used for channel selection, it can be used with the mouse to scale the displayed waveform, and it displays the numerical values of the waveform.
When more than one waveform is displayed on the screen, clicking the left mouse button in the unselected channel’s annotation margin selects that channel.
Clicking the left mouse button in the annotation margin of a selected channel doubles the vertical size of the waveform. Conversely, clicking the right mouse button in the annotation margin of a selected channel reduces the vertical size of the waveform by one half.
Clicking the right mouse button in the annotation margin of an unselected channel starts a graphic selection rectangle, which is used by the Edit Copy command.
A selection rectangle can also be used with the annotation margins to scale the waveform. For example, if you wanted to examine a small section of waveform in greater detail, it is possible to fill the entire channel with the small section of waveform. This is done by drawing a selection rectangle and then clicking the left mouse button in the annotation margin. A selection rectangle is drawn by dragging anywhere in the strip until the area of interest is enclosed in the rectangle. When the left mouse button is released, the rectangle remains on the display framing the area of interest. Now click the left mouse button in the annotation margin to enlarge the contents of the selection rectangle to full strip size. Conversely, the entire waveform can be shrunk to fit inside a similarly drawn rectangle using the right mouse button.
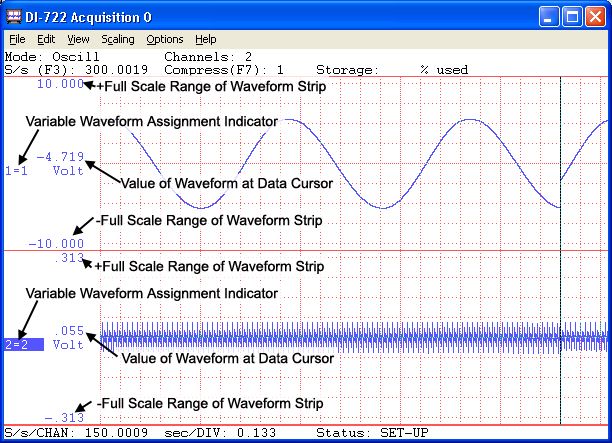
Only the left annotation margin is displayed when a non-overlapped screen format is selected, and both the right and left annotation margins are displayed when an overlapped screen format is selected. The information displayed in either margin is identical in format and consists of three parts: the variable waveform assignment indicator, the numeric value of the waveform at the real time point, and the ±full scale values for the waveform strip.
non overlapped display
overlapped display
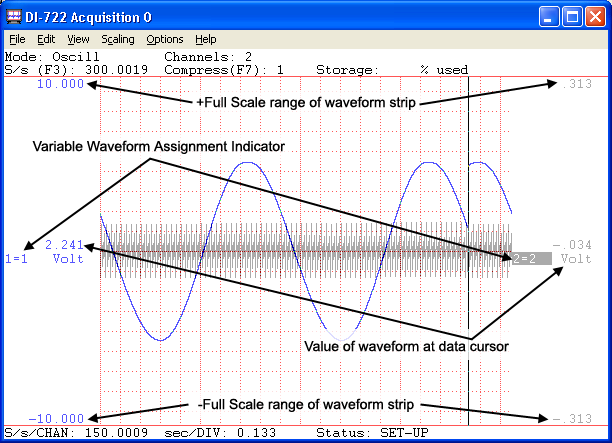
Variable waveform assignment indicator
The variable waveform assignment indicator allows any enabled channel to be assigned to a specified display window. The highlighted box surrounding the X=Y annotation indicates that the window is selected, meaning the waveform contained in the strip can be scaled, offset, or otherwise adjusted. Note that the waveform can only be scaled or adjusted when the window is selected.
Numeric value of waveform at real time point
This field appears when Data Display is enabled from the Options menu. When Current Data is enabled (also from the Options menu) in the oscilloscope display mode, this field displays the waveform value at the cursor position. When Current Data is enabled in the scroll display mode, this field displays the waveform value at the real time point (rightmost edge of window). When Current Data is disabled, this field displays the baseline value of the waveform window.
±Full scale values for the waveform strip
These values indicate the ±full scale values of the waveform window. If desired, these values may be specified and the waveform will be automatically scaled to fit the new values. This is useful for displaying the waveform strip in whole numbers (e.g., 0 - 200 mmHg instead of 10.372 - 189.628 mmHg).
While acquiring data continuously to disk, the waveform strip area maintains a real time display of the acquired waveforms. The real time display provides the most flexible and functional waveform display available. It allows you to maintain complete control over data acquisition parameters in real time through mouse and/or keyboard features. Control sample rate, waveform compression, the number of channels enabled, event markers, disk storage, and much more.
The bottom annotation line consists of three elements: the equivalent per channel sampling rate, the time per grid division, and the current operating mode.
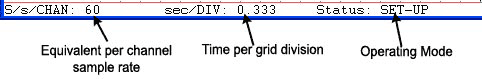
Equivalent per channel sampling rate
The equivalent per channel sampling rate is derived by dividing the selected sample throughput rate (displayed in the S/s (F3): field of the status bar) by the number of channels enabled.
Time per grid division
The time per grid division is a function of the selected sample rate, the number of channels enabled, and the selected waveform compression factor. The grid on the display provides a convenient time reference for the display in seconds or milliseconds per division.
Current operating mode
The current operating mode field displays one of the three data acquisition operating modes: SET-UP, RECORD, or STBY. See Operating Modes.