|
|
|
|
Fast Start Guide Step 3 |
|
|
|
|
|
( Internet Connection Required) |
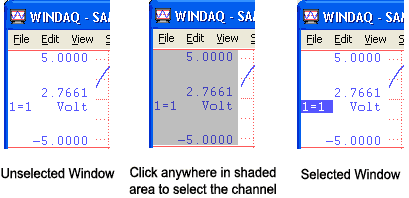
![]() Click the left mouse button in
the unselected channel's left/right
annotation margin.
Click the left mouse button in
the unselected channel's left/right
annotation margin.
![]() Type
the number or letter of the display window that contains the waveform
to be adjusted.
Type
the number or letter of the display window that contains the waveform
to be adjusted.
The focal point for selecting any waveform is the variable waveform assignment indicator of each channel. This is the two-element equality (X=Y) displayed for every channel window. Element “X” is the waveform window number or letter and element “Y” is the channel number assigned to that window. Element “X” (the waveform window) is always the element specified to select the waveform contained in that window for adjustment. When a waveform window is selected, a highlighted box surrounds the X=Y annotation, indicating that the window is enabled for adjustment.
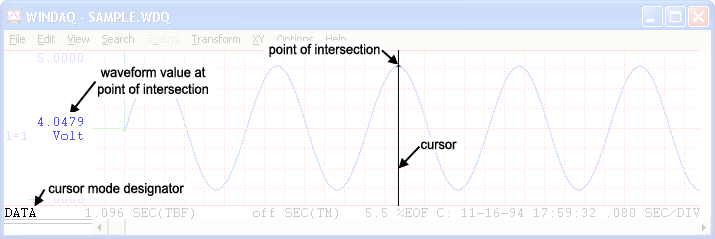
The Data Cursor allows annotation of waveform values at the point of waveform/cursor, or waveform/base line intersection. These values appear in the left/right annotation margin next to the Variable Waveform Assignment indicator. Enable the data display waveform annotation option before toggling waveform/cursor or waveform/base line values. With the data display option enabled, click on Data Cursor in the Options menu. A check mark next to Data Cursor indicates enabled status. Click anywhere in the bottom annotation line to activate the data cursor. Click directly under the data cursor in the bottom annotation line to disable it and enable waveform/base line intersection point values. As the following illustration shows, when cursor oriented waveform data is enabled, the cursor mode designator at the bottom of the screen indicates DATA.
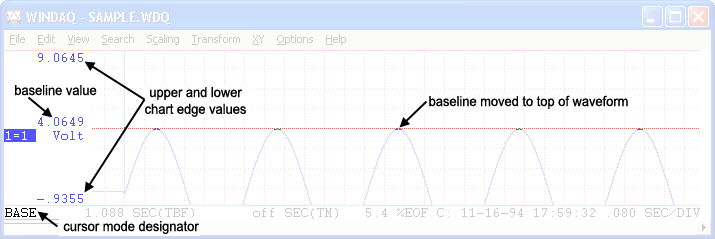
When base line oriented waveform data is enabled, the cursor mode designator indicates BASE. The annotated waveform value outputs either the raw waveform voltage or the waveform voltage converted into engineering units (if calibrated). When in BASE mode use the Page Up and Page Down keys to change the baseline value of a selected channel. This shifts the waveform up or down on the screen. The upper and lower chart edge values change to center the baseline value.
Moving the Cursor to the highest peak
Select a channel in which to find the highest point. Click on Peak on Screen in the Search menu or double click the left mouse button anywhere in the bottom annotation line. This moves the cursor to the highest waveform peak displayed on the screen for the selected channel.
Moving the Cursor to the lowest valley
Select a channel in which to find the lowest point. Click on Valley on Screen in the Search menu or double click the right mouse button anywhere in the bottom annotation line. This moves the cursor to the lowest waveform valley displayed on the screen for the selected channel.
Moving the Cursor to the Center of the Screen
Click on Center Cursor in the Search menu or click the right mouse button in the bottom annotation line. This moves the cursor to the enter of the screen. If your computer’s Scroll Lock function is enabled, the waveform will move to the center of the screen along with the cursor.