Fast Start Guide Step 6

Previous | Next


Step 6 Exporting to Excel

Click icon for demo

( Internet Connection Required)

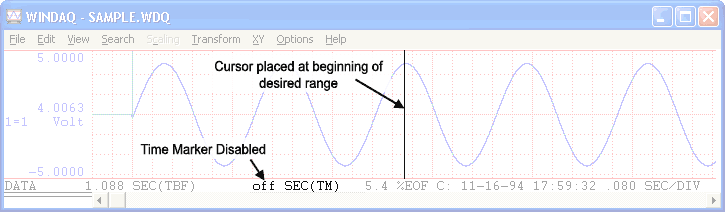
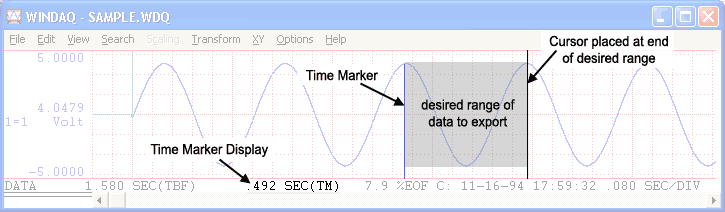
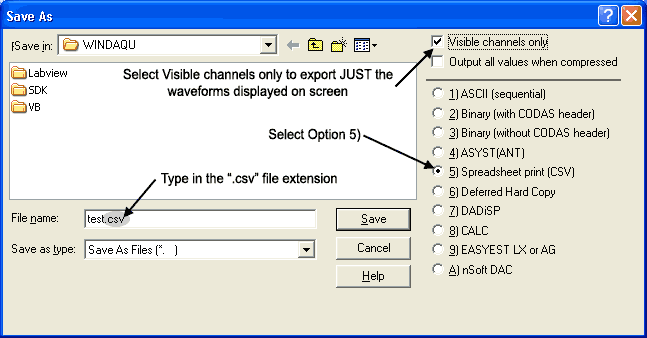
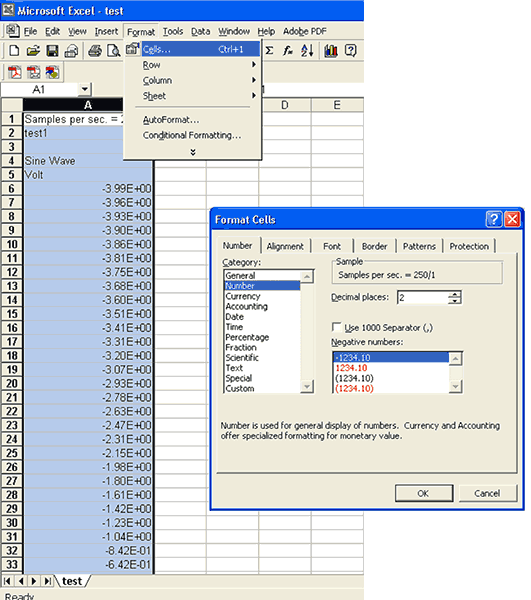
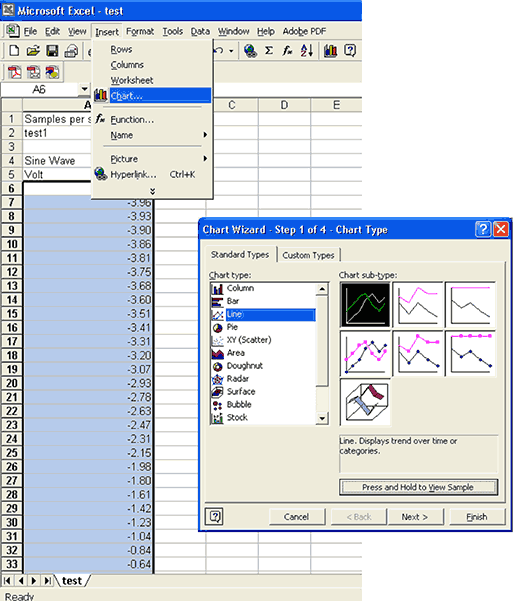
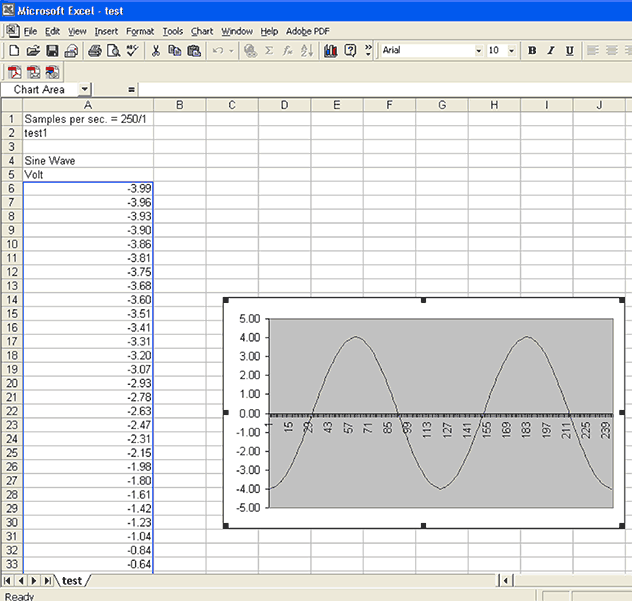
Use the Save As... command in the File menu to export a user-specified range of data from an existing data file to an Excel file.


  1. Select the copy range using the Time Marker.


  1. Position the cursor at the beginning of the desired range.


  1. Press F4 or select Enable Time Marker in the Options menu. This will place a check mark next to Enable Time Marker in the Options menu and will also show an increment of time in the bottom annotation line by the Time Marker (TM). When initially enabled it will show “.000 SEC(TM).” When disabled it will read “off SEC(TM).” See Select Marker Display to change the format. See also Time Marker.


  1. Position the cursor at the end of the desired range


  1. In the File menu click on Save As…. This displays the Save As dialog box.


  1. Select the file storage format option 5) Spreadsheet print (CSV). The file storage format selections appear on the right side of the dialog box. A description of each data storage format is included in the Help Files for the WinDaq Waveform Browser software.


  1. Enter a file name in the File name dialog box. Include “.csv” as the file extension in the file name. For example, enter “test.csv” into the file name dialog box. Click on Save to export the data—this copies the data within your selected range and from every channel in the file to the specified data file. To save only the channels displayed on-screen select the Visible channels only box in the top right hand portion of the Save As dialog box. To export specific channels, see Extract Channels.


  1. The Spreadsheet Comments dialog box allows you to export annotations from the WWB file and allows you to add new comments. Click in the appropriate check box to transfer Sample Rate, Comments, Channel Annotation, Engineering Units, Relative Time, or Event Marks. After selecting the desired options and adding comments, click the OK button to close the dialog box and save the file.


  1. The file will have an Excel icon—double-click on the file to open it in Excel.


  1. Convert data from scientific notation by changing the format of the cells to “Number” format. Highlight the data, in the Format menu click on Cells... then choose the desired format.


  1. Manipulate your data using any Excel function. Click on Chart... in the Insert menu to create a graphical representation of your data.


  1. Choosing a Line chart will output a chart identical to the waveform exported from WinDaq Waveform Browser.


Top