|
|
|
|
Power Spectrum Measurements |
|
While in the transform mode, it is possible to export the coordinates that define a transform plot to an ASCII file. This is done by:
![]() In
the Transform menu click on Output FRQ Data….
In
the Transform menu click on Output FRQ Data….
![]() Choosing
Transform Output FRQ Data (ALT,
T, O).
Choosing
Transform Output FRQ Data (ALT,
T, O).
This displays the Save Frequency Data to File dialog box as follows:
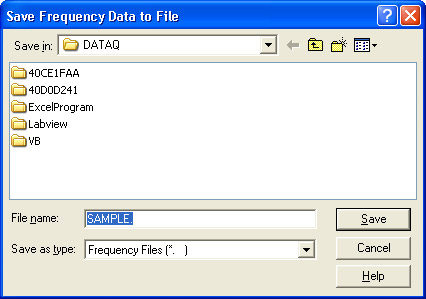
Enter in the text box the name of the data file (including desired path names) to which the ASCII file is to be written. When a file name is entered and the OK command button is activated, a second dialog box is displayed.
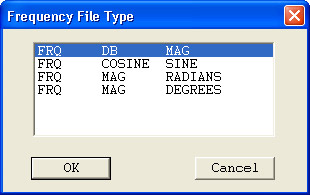
From this dialog box, you can specify the type of frequency information to be saved as an ASCII file. The transform plot information is saved as an ASCII file in the form of a three column spreadsheet. These three columns contain the information necessary to reproduce the spectrum four different ways in any spreadsheet program (or in any program that is capable of importing ASCII files). The FRQ DB MAG selection will reproduce the spectrum showing magnitude and frequency information (exactly as displayed in the plot area of WinDaq Waveform Browser software). The FRQ COSINE SINE selection will reproduce the spectrum in a rectangular coordinates format, showing phase information with the cosine value representing the real component and the sine value representing the imaginary component. The FRQ MAG RADIANS selection will reproduce the spectrum in a polar coordinates format, showing the vector angle in radians. The FRQ MAG DEGREES selection will also reproduce the spectrum in polar coordinates format, but with the vector angle in degrees.
When the desired file type is highlighted and the OK command button is activated, the transform plot is exported to an ASCII file. The display will return to the power spectrum plot and analysis can be resumed.
It is possible to reproduce the spectrum in the WinDaq Waveform Browser. This is useful when you wish to see phase information for a plot currently displaying magnitude and frequency information. ASCII files are saved in the form of a three column spreadsheet preceded by a header. The header contains the set up information used in the transform calculation including: the filename of the waveform, the assigned channel, position in the file from which the FFT was taken, compression applied to input, the number of averaged points in the FFT, window type used, and the size of the FFT. A portion of a sample file is shown as follows.
FILE = sample.dat
CHANNEL = 1
TBF OF LEFT POINT = 1.86080
TBF OF CENTER POINT = 1.912
TBF OF RIGHT POINT = 1.96300
SCREEN COMPRESSION = 1
INPUT AVERAGING = 1
WINDOW TYPE = hanning
FRQ SMOOTHING FACTOR = 1
POINTS = 512
|
FRQ 0. 10. 20. 29. 39. 49. . . |
DB -6.02 40.21 39.19 40.02 40.21 40.63 . . |
MAG 7.6294E-05 1.5640E-02 1.3899E-02 1.5302E-02 1.5631E-02 1.6023E-02 . . |
This header information may be used to completely reproduce the spectrum (in another format, if desired) through the WinDaq Waveform Browser. An FFT may be reproduced as follows:
A DFT spectrum may be reproduced as follows: