|
|
|
This format annotates the slope of an imaginary line formed by connecting the waveform value at the time marker position with the waveform value at the cursor position on the selected channel. To display the slope of the line to TM point in the live display field:
![]() In
the Options menu click on Select Live Display. This displays a
cascading pull-down menu containing the different data formats. Click
on Slope of line to TM pt.
In
the Options menu click on Select Live Display. This displays a
cascading pull-down menu containing the different data formats. Click
on Slope of line to TM pt.
![]() Choose
Options Select Live Display (ALT,
O, V).
Press ENTER. This displays a cascading pull-down menu containing the different
data formats. Use the ↑ and ↓ cursor control keys to highlight
Slope of line to TM pt. Press ENTER.
Choose
Options Select Live Display (ALT,
O, V).
Press ENTER. This displays a cascading pull-down menu containing the different
data formats. Use the ↑ and ↓ cursor control keys to highlight
Slope of line to TM pt. Press ENTER.
When the slope of line to time marker point format is selected, the live display field will show XXXXXXXXX SLOPETM, where XXXXXXXXX is the slope of an imaginary straight line between time marker position and cursor position (expressed in scientific notation).
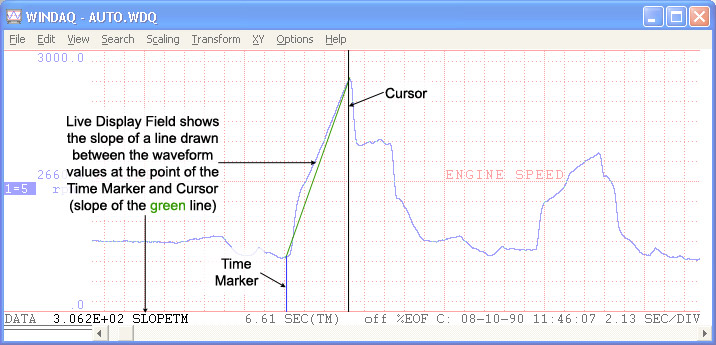
Note that a waveform must be selected and the time marker must be enabled for display in this format.
If the cursor is positioned directly on top of the time marker and compression is 1, the live display field displays on because the function is undefined.
If waveform compression is enabled, the data values reported by the time marker and cursor will be MID, MIN, MAX, or MxMn line segment values rather than a single data point value that would be displayed on an uncompressed waveform. Refer to Waveform Compression for more line segment value details.