|
|
|
|
Fast Start Guide Step 4 |
|
|
|
|
|
( Internet Connection Required) |
WinDaq allows compression of data to display a whole file on-screen or display portions of data in one screen-width. Click on Compression... in the Edit menu to access waveform compression options.
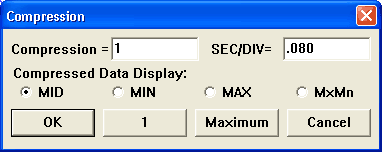
To compress an entire file into one window-width click on the Maximum button in the compression dialog box. To fully un-compress the file click on the 1 button in the compression dialog box. The cursor position in maximum compressed mode will become the center of the screen whenever lowering compression.
The selected waveform compression ratio outputs in the Compression = text box. The Compression ratio equals the number of data points evaluated for a min/max value for each enabled channel. For example, if the compression ratio equals twenty, then twenty data points are evaluated to plot a min/max point. This ratio can range from -10 to whatever value required to compress the entire file on the screen (Maximum). Entering negative values in the Compression text box will expand the waveform. To find the maximum possible compression value: Fully compress the waveform (Maximum); then re-access the compression dialog box (Edit > Compression...)—the Compression = text box displays the maximum possible compression value. To increase or decrease the compression ratio enter the desired number. If you choose a compression value that is too large, an “Invalid Compression” message box will appear. Click OK or press ENTER to clear the message box and try a smaller compression value.
Cursor Mode Control (Mid/Min/Max/MxMn) for compressed displays
The waveform compression function operates by accumulating x number of waveform samples (where x equals the compression ratio). WinDaq calculates these values and displays a min/max line where the end points of the line equal the absolute minimum and maximum values detected for the sample group. The cursor mode control allows you to specify the desired value to report as either the minimum (MIN), maximum (MAX), mid point (MID), or maximum and minimum values (MxMn). To select the desired line segment reporting method click the desired option button and click OK.
The currently active cursor mode displays at the bottom of the screen where the DATA annotation is replaced by MIN, MAX, MID, or MxMn (default = MID). Both maximum and minimum values (separated by a slash, in the left/right annotation margin) are displayed in MxMn mode.
See also Waveform Compression.