|
|
|
|
Power Spectrum Measurements |
|
When a power spectrum is plotted, the entire spectrum is displayed on the screen regardless of the number of points in the transform. If a transform containing a large number of points is performed, the resulting power spectrum is compressed in order to fit on one screen width. This is fine for spotting the overall trend of a spectrum but what if you wanted to examine a selected portion of the plot more closely? This can be done by scaling the frequency axis.
A video standard of 1024 x 768 provides 1024 picture elements (pixels) of horizontal resolution. If a 512-point FFT is performed, the 256 points generated by the transform fit nicely on a screen capable of horizontally displaying 1024 points. The same is true of a 1024-point FFT, where a 1024 pixel-wide screen is more than adequate to contain the 512 points generated by the transform. The problem arises when a transform larger than 2048 points is performed. Suppose an 8192-point FFT is performed. The 4096 points generated by the transform is much wider than the 1024 pixel width of the screen. So in order to get the entire power spectrum on one screen width, a compression factor (in this case, a factor of 4) is automatically applied. To zoom in on the power spectrum and examine a selected portion in greater detail, you must magnify the spectrum (or in effect, scale the frequency axis).
After the power spectrum is plotted, scaling of the frequency axis may be used to examine a selected portion of the plot more closely. To do this, scroll the cross hair along the spectrum until it reaches the desired section of the plot and:
![]() In
the Transform menu click on Compress FRQ….
In
the Transform menu click on Compress FRQ….
![]() Choose
Transform Compress FRQ… (ALT,
T, C).
Choose
Transform Compress FRQ… (ALT,
T, C).
This displays the Frequency Compression dialog box as follows:
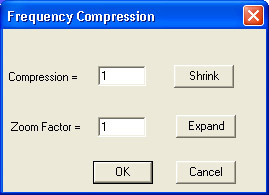
From this dialog box, you activate the Expand command button to change the spectrums frequency compression. Successive activation's apply increasing magnification scaling factors to a maximum value of 4X. When the desired magnification factor is entered, activating the OK command button applies the magnification. When the spectrum is magnified in a way that prohibits the display of the entire power spectrum on a single screen width, a scroll bar appears at the bottom of the plot area, allowing you to pan the entire plot.
Activating the shrink command button decreases the magnification factor to a limit of ÷p, where p = [(n/2+1)/640]+1 and is the number of pages needed to display individual frequencies of an n-point transform. The current power of magnification is displayed in the analysis reporting area as follows:
![]()
![]()
![]()
![]()
Whenever a magnification factor greater than 1/p is active, the entire power spectrum cannot appear on a single screen width. For this reason, a scroll bar automatically appears at the bottom of the plot to allow you to easily examine the entire plot.