
The WinDaq XY Viewer
The WinDaq XY Viewer is a separate utility that “eavesdrops” on channels of waveform data that are being acquired by WinDaq Acquisition. The WinDaq XY Viewer then simultaneously creates and displays an XY plot of this “overheard” data on your monitor, using the same engineering units and calibration information as the WinDaq Acquisition file.
Accomplished transparently to WinDaq Acquisition, this utility allows you to plot the relationship of one channel versus another as they are being acquired to disk, rather than each channel plotted with respect to time (which is what WinDaq Acquisition displays). A minimum of two waveform channels (one X-axis and one Y-axis) or a maximum of eight waveform channels (four X-axis and four Y-axis) can be plotted at one time, and in different colors. You designate which channel(s) will be the independent (or X-axis) variable and the dependent (or Y-axis) variable. For example, the following WinDaq Acquisition window shows two waveforms.
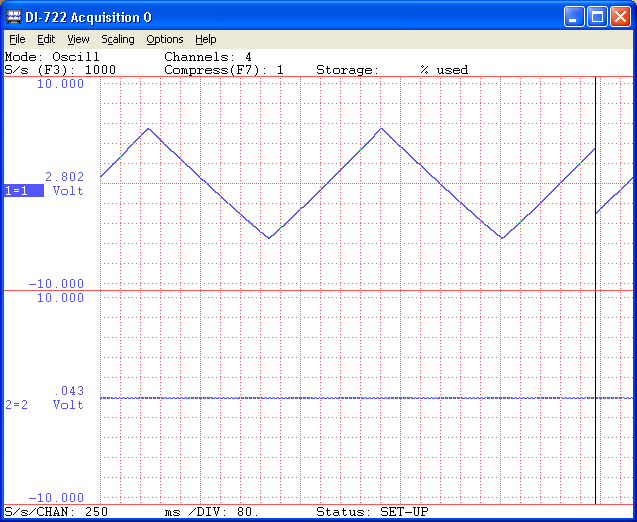
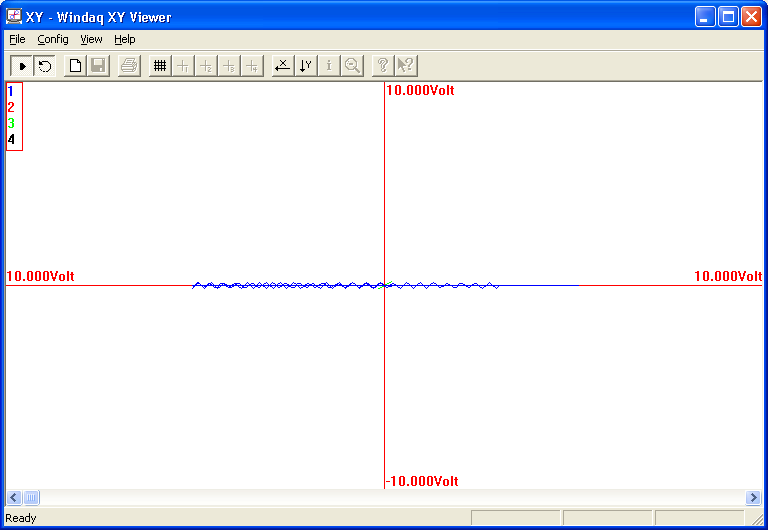
The adjacent WinDaq XY Viewer window simultaneously shows the same data but instead of being plotted with respect to time, the waveforms are plotted with respect to each other.