
The WinDaq XY Viewer > Fast Start
To start the WinDaq XY Viewer, you must first start WinDaq Acquisition.
Start the WinDaq XY Viewer.
![]() Double-clicking
the WinDaq XY Viewer icon.
Double-clicking
the WinDaq XY Viewer icon.
![]() Use
the ←, ↑, →, or ↓ cursor control keys to highlight
the WinDaq XY Viewer icon and press ENTER.
Use
the ←, ↑, →, or ↓ cursor control keys to highlight
the WinDaq XY Viewer icon and press ENTER.
Before an XY plot can be generated, you must decide which channel will be the independent (X-axis) variable and which will be the dependent (or Y-axis) variable. To assign the channels for each axis:
![]() In
the Config
menu click on Channels….
In
the Config
menu click on Channels….
![]() Choose
Config Channels…
(ALT, C, A).
Choose
Config Channels…
(ALT, C, A).
This displays the Channel Selection dialog box.
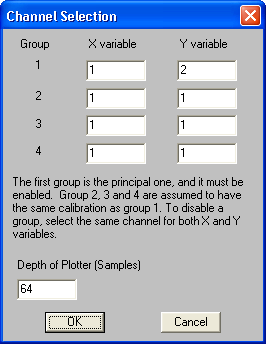
This is where you assign the channels for each axis. Up to 4 groups or combinations of X and Y waveform channels can be displayed at the same time (8 total channels).
The Depth of Plotter (Samples) text box allows you to vary the number of samples displayed on your monitor at any one time. Valid entries range from 16 to 2048. For example, say 64 is entered in the Depth of Plotter (Samples) text box. This means that 64 data points will be displayed on the monitor at all times. When loop mode is enabled, data is continuously plotted on the monitor. The newest data points simply overwrite the oldest, maintaining 64 data points on the display (see XY Viewer Menus). When the one-shot mode is enabled (this happens automatically when loop mode is disabled), the plotting process will stop when 64 data points have been displayed on the monitor.
When channels and view depth have been set, close the dialog box by choosing the OK command button.
![]() Click
on Go in the File
menu.
Click
on Go in the File
menu.
![]() Choose
File Go (ALT, F, G).
Choose
File Go (ALT, F, G).