
The WinDaq XY Viewer > Window
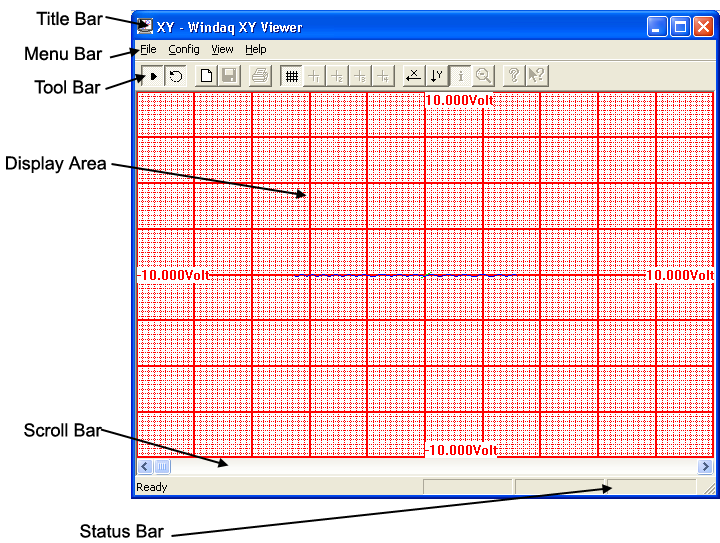
The typical WinDaq XY Viewer window consists of six fundamental components: the title bar, menu bar, tool bar, display area, data cursor scroll bar, and the status bar.
The title bar has two purposes: it identifies a file through the file name and it serves as a visual cue that the window may be moved or manipulated. The title bar consists of three parts: the system menu icon, the window title, and the window sizing icons.
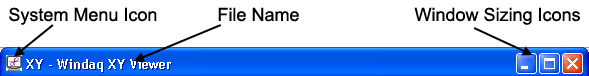
System menu icon
The system menu icon can be selected to display a pull-down containing commands for moving, sizing, and closing windows on the screen. You can use either the mouse or the keyboard to size and move a window, but because of the many mouse shortcuts built into the WinDaq XY Viewer program, the mouse is faster and easier. For example, moving the window by dragging with the mouse is a much faster alternative to selecting the Move command from the system menu, repositioning with the arrow keys, and then pressing the ENTER key. Whenever applicable, the mouse shortcuts are included in the system menu command descriptions that follow. The commands are: Restore, Move, Size, Minimize, Maximize, Close, Switch To…, and Always on Top.
Window title
The window title contains the WinDaq XY Viewer utility name and the currently active data storage file name.
Window sizing icons
The window sizing icons provide a fast, convenient way to use the mouse to select three of the system menu actions: Minimize, Restore/Maximize, and Close. Selecting one of these icons with the mouse performs that action, which is identical to selecting it from the system menu.
Like other Windows applications, WinDaq XY Viewer contains a menu bar. The commands available are grouped on menus. These menus appear in the bar across the top of the window and represent the heart of the WinDaq XY Viewer package.
![]()
With these menus you can apply the powerful capabilities of the WinDaq XY Viewer. To choose a command from a menu, you can either point to the desired menu and click, or press the ALT key and then the underlined letter of the desired menu. This causes the commands available on that menu to be “pulled down” or displayed. Once displayed, the commands on the pull-down menu can be chosen (and thus performed) by clicking on the desired command or by pressing the underlined letter in the desired command. Also provided on the pull-down menus are keyboard shortcuts or accelerators. Accelerators are function keys or combinations of keys displayed next to some menu items that when pressed, immediately invokes the desired action. This lets you bypass the pull-down menus and carry out commands directly from the keyboard, when you know the proper keystrokes.
When you choose a command that is followed by an ellipsis (…), WinDaq XY Viewer displays a dialog box indicating that more information must be entered or an option must be selected before the command can be carried out.
Some command names occasionally appear dimmed. This indicates that the command does not apply to the current situation or that you may need to make a selection or complete an action before choosing the command.
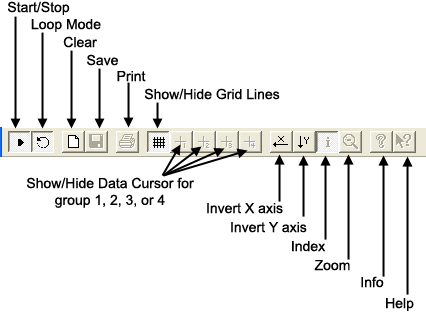
The tool bar provides quick access to the commands used most often. For example, you can click the magnifying glass button on the tool bar instead of clicking on the View menu and dragging down to the Zoom Out command. Both methods accomplish the same result, but the tool bar button is quicker and more convenient. The following illustration shows each button and the task it accomplishes.
The display area contains the XY plot of the data “overheard” from your computer’s ISA bus. Examining the XY plot is possible through use of a data cursor or cross hair, which may be scrolled over the XY plot. The cross hair is enabled by choosing Data Cursor from the View menu (note that you must stop the XY plotting process to make the Data Cursor command selectable). When enabled, the data cursor scroll bar can be used to trace every data point on the XY plot. When the XY plot is traced by the data cursor, the data fields in the bottom annotation line shows various values at the XY plot/data cursor intersection.
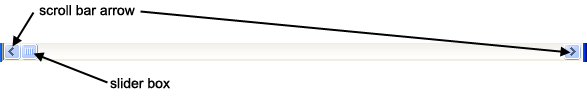
The data cursor scroll bar is used to move or trace the data cursor (or cross hair) over the XY plot in the display area. The data cursor scroll bar has no affect when XY plotting is active. You must stop the XY plotting process to use the data cursor scroll bar. Note that the cursor is automatically displayed when the scroll bar is used (there is no need to enable the data cursor before using the scroll bar).
Dragging the slider box scrolls or traces over each data point in the XY plot, simultaneously updating the data fields in the bottom annotation line. Clicking the left or right scroll bar arrow also traces the XY plot and updates the data fields. Clicking and holding either scroll bar arrow continuously traces the XY plot and updates the data fields until the beginning or end of the data is reached. Clicking anywhere in the data cursor scroll bar on either side of the slider box scrolls the cursor five data points toward the beginning or end of the data.
The status bar is the information center of the WinDaq XY Viewer. It consists of four elements: the message field, the index/time field, the X value field, and the Y value field.
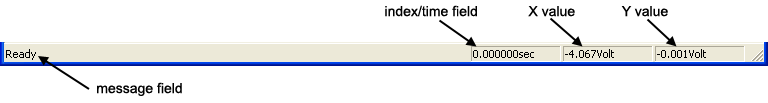
Message field
This field displays a brief description of the command you are about to select from a pull-down menu or when you click a tool bar button. You can view the description of each tool bar button by placing the mouse pointer on the button and clicking and holding the left mouse button. If after viewing the description of the tool bar button you wish not to execute the command, move the mouse pointer off of the tool bar button and release the mouse button.
Index\Time field
This field displays the XY data pair currently under the data cursor (cross hair) either as an indexed number (the position of the data point in the buffer) or as elapsed time from when the very first data pair were plotted. Note that you must stop the plotting process and choose the Use Index command from the View menu (or activate the toolbar button) to display data in this field. Subsequent activations of this command toggles the display between the index display and elapsed time display.
X value field
This field displays the X-axis value of the plot at the cross hair position. Note that you must stop the plotting process and choose the Use Index command from the View menu (or activate the toolbar button) to display data in this field.
Y value field
This field displays the Y-axis value of the plot at the cross hair position. Note that you must stop the plotting process and choose the Use Index command from the View menu (or activate the toolbar button) to display data in this field.