|
|
|
|
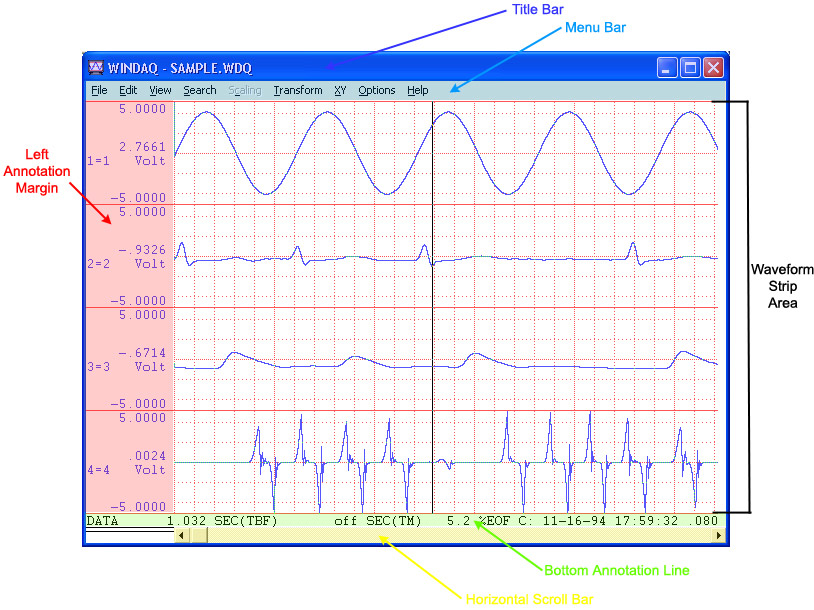
The Browser Window | Title Bar | Menu Bar | Left/Right Annotation Margin Waveform Strip | Bottom Annotation Line | Horizontal Scroll Bar |
|
|
|
|
|
The Browser Window | Title Bar | Menu Bar | Left/Right Annotation Margin Waveform Strip | Bottom Annotation Line | Horizontal Scroll Bar |
|
The typical WinDaq Waveform Browser window consists of six fundamental components: the title bar, menu bar, left/right annotation margin, waveform strip, bottom annotation line, and the horizontal scroll bar. These components are shown in the following illustration.
Before we examine each component of the WinDaq Waveform Browser window in detail, we will describe some basic skills that will help you navigate within or otherwise work with windows. WinDaq Waveform Browser works exactly like those of most Windows™ applications. If you’ve worked with Windows applications before, much of this material will already be familiar to you.
As you can in any Windows application, you can open several WinDaq Waveform Browser windows, or you can open other applications in separate windows outside of the WinDaq Waveform Browser window. However, you can work in only one window at a time. The window in which you are currently working is called the active window—the very next command or action you perform occurs in this window. You use either the mouse or the keyboard to scroll through, switch between, size, move, or close windows.
The title bar has two purposes: it identifies a file through the file name and it serves as a visual cue that the window may be moved or manipulated. The title bar consists of three parts: the system menu icon, the window title, and the window sizing icons.
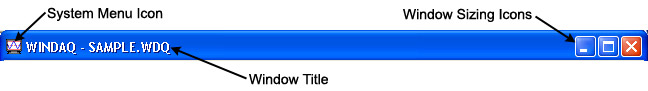
System menu icon
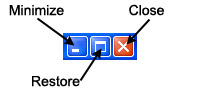
The system menu icon can be selected to display a pull-down menu containing commands for moving, sizing, and closing windows on the screen. You can use either the mouse or the keyboard to size and move a window, but because of the many mouse shortcuts built into the WinDaq Waveform Browser program, the mouse is faster and easier. For example, moving the window by dragging with the mouse is a much faster alternative to selecting the Move command from the system menu, repositioning with the arrow keys, and then pressing the ENTER key. Whenever applicable, the mouse shortcuts are included in the system menu command descriptions that follow. The commands are: Restore, Move, Size, Minimize, Maximize, Close, Switch To…, and Always on Top.
Window title
The window title contains the WinDaq WAVEFORM BROWSER utility name and the currently active data file name.
Window sizing icons
The window sizing icons provide a fast, convenient way to use the mouse to select three of the system menu actions: Minimize, Restore, and Close. Selecting one of these icons with the mouse performs that action, which is identical to selecting it from the system menu.
Like other Windows™ applications, WinDaq Waveform Browser contains a menu bar. The commands available in WinDaq Waveform Browser are grouped on menus. These menus appear in the bar across the top of the window.
![]()
With these menus you can apply the powerful waveform review and editing capabilities of WinDaq Waveform Browser. To choose a command from a menu, you can either click on the desired menu, or press the ALT key and then the underlined letter of the desired menu. This causes the commands available on that menu to be “pulled down” or displayed. Once displayed, the commands on the pull-down menu can be chosen (and thus performed) by clicking on the desired command or by pressing the underlined letter in the desired command. Also provided on the pull-down menus are keyboard shortcuts or accelerators. Accelerators are function keys or combinations of keys displayed next to the menu item that when pressed, immediately invokes the desired action. This lets you bypass the pull-down menus and carry out commands directly from the keyboard, a time-saving feature when processing repetitive tasks. Refer to the WinDaq Waveform Browser Command Hierarchy for a listing of accelerators.
When you choose a command that is followed by an ellipsis (…), WinDaq Waveform Browser displays a dialog box indicating that more information must be entered or an option must be selected before the command can be carried out.
Some command names occasionally appear dimmed. This indicates that the command does not apply to the current situation or that you may need to make a selection or complete an action before choosing the command.
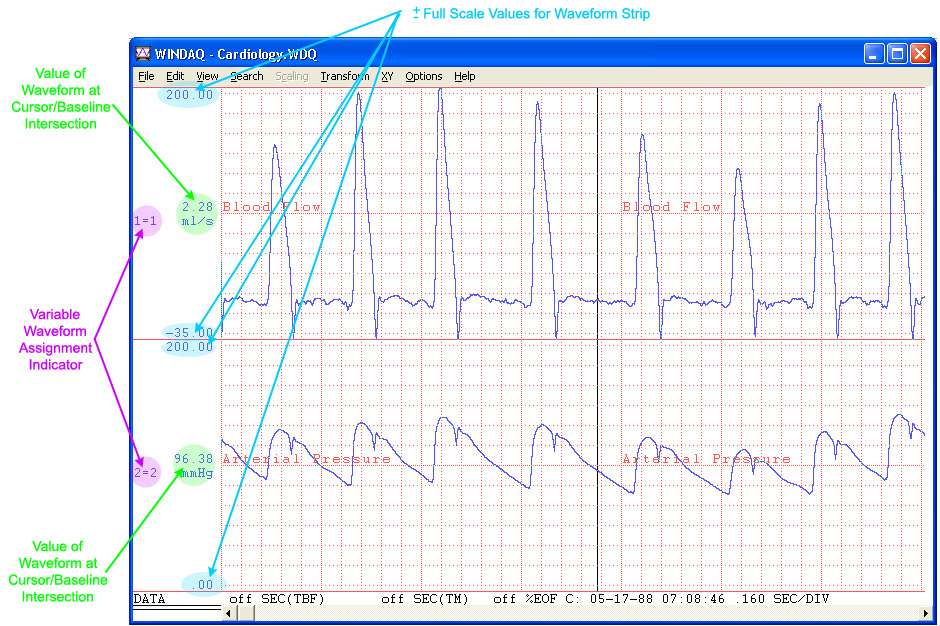
The left and/or right annotation margin has three purposes: it can be used for waveform strip selection, it can be used with the mouse to scale the displayed waveform, and it displays the numerical values of the waveform.
When more than one waveform is displayed on the screen, clicking the left mouse button in the unselected strip’s annotation margin selects that strip.
Clicking the left mouse button in the annotation margin of a selected strip doubles the vertical size of the waveform. Conversely, clicking the right mouse button in the annotation margin of a selected strip reduces the vertical size of the waveform by one half.
Clicking the right mouse button in the annotation margin of an unselected strip starts a graphic selection rectangle, which is used by the Edit Copy or File Print commands.
A selection rectangle can also be used with the annotation margins to scale the waveform. For example, if you wanted to examine a small section of waveform in greater detail, it is possible to fill the entire strip with the small section of waveform. This is done by drawing a selection rectangle and then clicking the left mouse button in the annotation margin. A selection rectangle is drawn by dragging anywhere in the strip until the area of interest is enclosed in the rectangle. When the left mouse button is released, the rectangle remains on the display framing the area of interest. Now click the left mouse button in the annotation margin to enlarge the contents of the selection rectangle to full strip size. Conversely, the entire waveform can be shrunk to fit inside a similarly drawn rectangle using the right mouse button.
The left annotation margin is displayed whenever a non-overlapped screen format is selected, and both the right and left annotation margins are displayed when an overlapped screen format is selected. The information displayed in either margin is identical in format and consists of three parts: the variable waveform assignment indicator, the value of waveform at cursor/baseline intersection, and the ±full scale values for the waveform strip.
Non overlapped Display
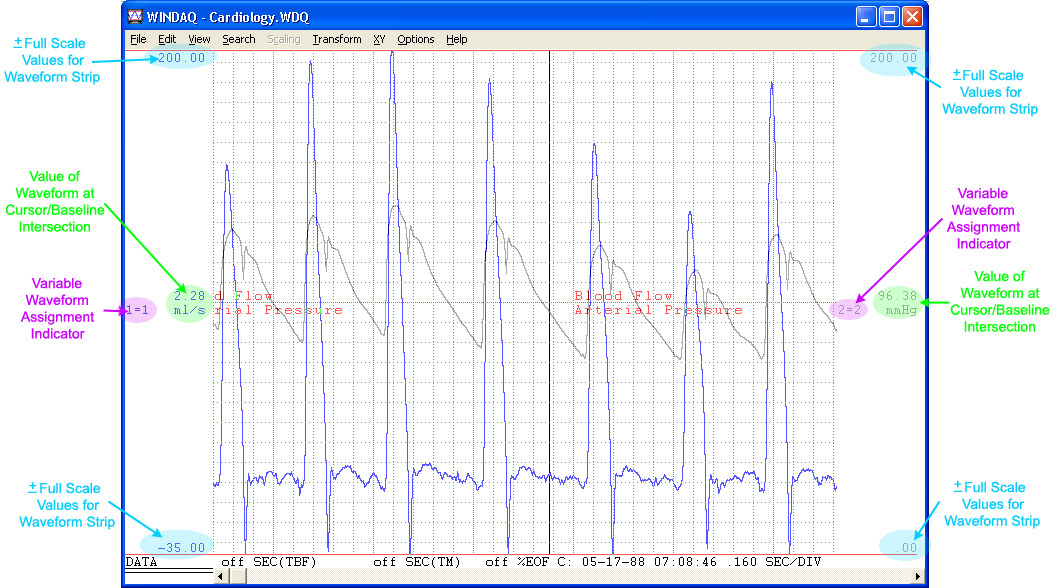
Overlapped Display
Variable waveform assignment indicator
The variable waveform assignment indicator allows any valid waveform channel to be assigned to a specific strip. The highlighted box surrounding the X=Y annotation indicates that the strip is selected, and the waveform contained in the strip can be scaled, offset, or otherwise adjusted.
Value of waveform at cursor/baseline intersection
When the data cursor is enabled for display, the waveform value at the point of waveform/cursor intersection is displayed. When the data cursor is not displayed, the waveform value at the point of waveform/baseline intersection is displayed.
±Full scale values for the waveform strip
These values indicate the ±full scale values of the waveform strip. If desired, these values may be specified and the waveform will be automatically scaled to fit the new values. This is useful for displaying the waveform strip in whole numbers (e.g., 0 - 200 mmHg instead of 10.372 - 189.628 mmHg).
The waveform strip area is where the recorded waveform information is replayed. Waveform information recorded during data acquisition is streamed from disk and displayed on the monitor in graphical form for review. In this area, you can expand or contract the amplitude of the selected strip, make cursor-oriented time and amplitude measurements, compress the waveform so it can be displayed in its entirety on the screen, overlap waveforms to examine how they correlate, perform event mark searches, display up to 32 waveforms at once, and much more.
The bottom annotation line serves two purposes: it contains the waveform measurement displays, and when used with the mouse, controls cursor motion and peak/valley searches.
Clicking the left mouse button anywhere in the bottom annotation line moves the data cursor to the position of the mouse pointer. If the data cursor is not enabled for display, clicking the left mouse button anywhere in the bottom annotation line displays the data cursor.
Dragging with the mouse positioned anywhere in the bottom annotation line moves the cursor to the desired position, simultaneously updating the data display.
Double-clicking the left mouse button anywhere in the bottom annotation line moves the data cursor to the highest peak of the waveform displayed on the screen or to the highest peak within the limits of a selection rectangle, if drawn.
Clicking the right mouse button anywhere in the bottom annotation line automatically centers the data cursor on the screen.
Double-clicking the right mouse button anywhere in the bottom annotation line moves the data cursor to the lowest valley of the waveform displayed on the screen or to the lowest valley within the limits of a selection rectangle, if drawn.
The bottom annotation line consists of five elements: the cursor mode indicator, the live display field, the marker display field, the distance-to-end-of-file function, and the time reference function.
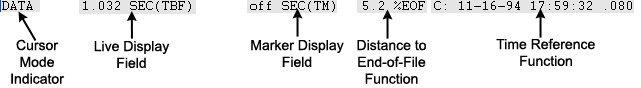
Cursor mode indicator
The cursor mode indicator displays the mode of the waveform value annotation. When baseline-oriented waveform data is enabled (accomplished by disabling the data cursor from the Options menu), the cursor mode indicator displays BASE. When cursor-oriented waveform data is enabled, the cursor mode indicator displays DATA (assuming the waveform compression factor is 1). If the waveform is compressed, the mode indicator will display MID, MIN, MAX, or MxMn, depending on the chosen method of line segment reporting. Refer to Waveform Compression for more details.
See also Waveform Data Function.
Live display field
The live display field reports waveform information in one of four selectable data display formats. As the waveform is panned across the screen (or as the cursor is moved), the selected display format is constantly updated to provide a "live” readout. The display formats are as follows:
See also Enable Live Display.
Marker display field
The marker display field reports the data lying between the time marker and current cursor position in one of four selectable time-related formats:
See also Select Marker Display.
Distance-to-end-of-file function (%EOF)
The distance-to-end-of-file function indicates your current position in the data file (expressed as a percentage) with respect to the end of the file. See also Distance to End of File.
Time reference function
The time reference function provides a time reference for the waveform in one of four selectable formats:
See also Time Reference Functions.
The horizontal scroll bar controls horizontal waveform motion. With it, you can move from one part of the waveform file to another.
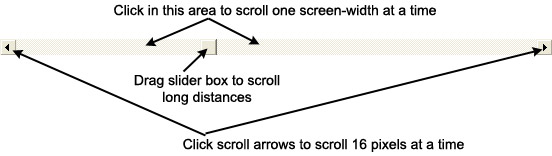
The position of the slider box within the scroll bar serves as a rough guide to the position of the window relative to the rest of the waveform file. If the window is revealing a section of waveform one-third of the way from the beginning of the waveform file, the slider box will be about a third of the way from the left end of the scroll bar.
Dragging the slider box selects the desired position in the file, simultaneously updating the TBF, TM, and %EOF functions (if enabled). This action is useful for scrolling long distances.
Clicking the left or right scroll bar arrow scrolls the waveform 16 pixels. Clicking and holding (but not dragging) in either scroll arrow repeats the scrolling action until the beginning or end of the file is reached. Pressing ALT + left or right scroll arrow activates the automatic scrolling mode. The waveform file will automatically scroll in the chosen direction, without any user intervention, until the end (or beginning) of the data file is reached or any other key is pressed. For optimum scrolling speed, ensure that the window is positioned entirely on the screen. Note that if a portion of the currently active window is hidden offscreen, scrolling speed is dramatically reduced. For best scrolling speed results, position (or resize) the active window so it is contained entirely onscreen.
To scroll by less than 16 pixels, drag the cursor (by positioning the mouse in the bottom annotation line) to the desired point. If desired, this new position can be centered on the screen by pressing the gray star key (*) on the numeric keypad with the SCROLL LOCK feature enabled.
Clicking anywhere in the horizontal scroll bar on either side of the slider box scrolls the waveform one screen width toward the beginning or end of the data file. The mouse button can be held down to scroll rapidly until the slider box reaches the mouse pointer.
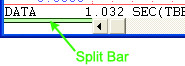
Split Bar
The split bar appears at the left end of the horizontal scroll bar. The split bar allows you to adjust the size of the split between the top and bottom screen sections or panes. These panes are used with the Transform function and allow you to adjust the amount of screen space devoted to the Fourier Transform. When the mouse pointer is positioned anywhere inside the split bar, the pointer takes on a different shape, indicating you can drag with the left mouse button to adjust horizontal pane size.