Converting Input Signal to Engineering Units
|
Click icon to watch this demo on YouTube (Internet Connection Required) |
All waveform data is initially scaled, annotated, and displayed in volts, which in many cases is not very meaningful. Change EU (Engineering Units) settings to give meaning to the displayed data. Instead of volts, your data can be scaled, annotated, and displayed in significant engineering units (i.e., PSI, RPM, lbs, ft/s, etc.). Calibration is done primarily for display purposes, it makes the data more visually appealing and easier to understand on your monitor. However when you calibrate, the calibration information is saved in an accompanying header file along with the data file. This header file stores the calibration information, allowing it to be re-used and thus eliminating the need to calibrate again. So, calibration is not entirely for display purposes.
Ensure that the window containing the waveform to be calibrated is selected. Although not required, the current data and data display options can be enabled for more recognizable results (see Screen Annotation ).
1. Select Engineering Unit Settings...
![]() Click
the Calibration button in the Toolbox.
Click
the Calibration button in the Toolbox.
![]() In
the Edit menu click on Engineering Unit Settings….
In
the Edit menu click on Engineering Unit Settings….
![]() Choose
Edit Engineering Unit Settings… (ALT, E, E) or use CTRL+ F8
Choose
Edit Engineering Unit Settings… (ALT, E, E) or use CTRL+ F8
When selected, the Engineering Unit Settings dialog box is displayed:
2. When the relationship of volts to engineering units is known, define the relationship in the provided text boxes. For example, you know 5V equals 1500 PSI and 0V equals 0 PSI using your sensor. Enter the Volt and EU value in the appropriate text boxes:
3. Use the eyedroppers when you do not know the relationship of volts output from the sensor versus engineering units. Click either eyedropper to take a sample of the data in volts when a known engineering unit value is applied to the signal input or found at the cursor position for that channel. The sample value will appear in the volts dialog box. Enter the corresponding engineering units in the EU text box. Perform the same operation on the opposite end of the range. It is best to sample as close as possible to the upper and lower limits of your intended measurements to ensure accurate readings.
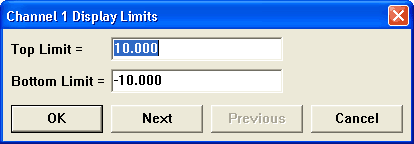
4. Click OK to save the settings. Note that screen scaling for the adjusted channel may change, but can be redefined by selecting LIMITS... from the SCALING pull-down menu (see Scaling Limits or read instructions below). Click Next to save the settings and open the dialog box for the next channel. Click Previous to save the settings and open the dialog box for the previous channel. Cancel exits the box without saving any settings.
Revert to the previous calibration settings with the Reset EU command (Edit > Reset EU or CTRL+F12).
See Special Considerations for information on the Set Offset button
Specify convenient upper and lower chart edge values