
 View Cart
 sales@dataq.com
 330-668-1444
Secrets For Successful High Speed Data Acquisition
(Originally Published In Measurement & Control Magazine)
Spreadsheets, word processing, data bases, web browsers, servers, email, flight simulators, Doom™ — of all the jobs we make our personal computers do, none tasks them more than high speed, real time data acquisition. No application will more quickly reveal the weaknesses of the PC, the software, or both than a multi-channel data acquisition program streaming data to disk at over 1 kHz per channel while maintaining a real time display. At these rates seemingly well-behaved software can disintegrate, and the PC itself could mimic the performance of its great grandfather '286.
Spotting high speed data acquisition trouble before it ruins a critical test is the topic of this article. In it, we'll explore software characteristics that not only allow high speed measurements, but will do so on slower PCs. In so doing, we'll touch on topics such as executable files sizes and data file formats. We'll also discuss advanced sampling techniques such as intelligent oversampling and selectable sample rates per channel. We'll explore how the software should react when there is a problem by exploring gap detector routines and their importance to high speed data acquisition. Finally, we'll touch on the importance of waveform review software that helps you evaluate your acquired data.
Real Work For Your PC
The premise of this article is that high speed data acquisition tests the mettle of your PC. Before going too far, it's appropriate to explain why to enhance your appreciation of the concepts described herein. Let's begin by tracing the operations that must be performed by a PC to acquire a single point. Our definition of "acquire" includes all the elements common to data acquisition, not just the simple transfer of an analog to digital (ADC) reading. They include maintaining a real time display, servicing keyboard and mouse interrupts, multitasking, and more. Here's what you'd do in a high speed data acquisition application if you were the PC:
- Poll the data acquisition device for an ADC value if operating in the so-called immediate mode (not likely for high speed data acquisition). Scan lists, which are more appropriate, allow a continuous stream of acquired data into your memory. In this instance, determine which of the readings is next, then get it.
- Store the acquired value to a disk buffer where it will stay until streamed to disk.
- Plot the acquired data on the real time display. Don't cheat! Connect individual samples with lines so your user can interpret what's going on. Further, don't dawdle. A display that's delayed by a few seconds violates the definition of real time. Make sure you don't fall behind.
Here, you work your way through multiple layers of code courtesy of Microsoft and Windows. How well this process progresses is a function of your clock speed and the intelligence of your graphics card. It's also determined by how efficiently your program was coded. Did the programmer take the easy way out and use system calls, or was he a pro who drilled his way to your most fundamental level and allowed you to use time-saving assembly code? - Since the typical application requires information scaled in units other than ADC counts, you have to multiply each reading by an m scaling constant and add a b scaling constant. This operation transforms raw ADC counts into something meaningful when displayed, like psi, or volts.
- Is the disk buffer full yet? Then stream a block of data to the hard disk. And check to make sure all the data made it. The hard drive always seems to fall behind. Do these things, but don't interrupt the real time display or the flow of data into the disk buffer. Jerky real time displays are too hard to interpret, and a buffer overrun means data that's lost forever.
- Monitor and react to the user's mouse and keyboard activity in a timely fashion (within a few hundred milliseconds). Things change during a test and the user may want to annotate any given event with a comment, expand or contract a real time display in the X or Y direction, change the number or order of displayed waveforms, or even change waveform calibration.
- This is a multitasking Windows environment and (nuts!) the user just started Microsoft Excel. Go load the Excel spreadsheet and perform some calculations there. Yes, this is a real time application and the user would like to have both the Excel spreadsheet and data acquisition real time displays on the screen at the same time. And don't drop any data going to disk. That's the kiss of death in a real time application like this.
- Now, perform all these operations while ADC data is flying at you from the data acquisition device at a rate of 1,000, 10,000, 200,000, or even 500,000 samples per second. You're a Pentium, after all. That shouldn't be a problem.
Given all these details (and a lot more that I've left out) it's amazing that true real time data acquisition applications work at all. The fact is, many don't.
Bigger Is Not Better
We live in an age when computer software is often referred to as bloatware. We've installed hard disks on our PCs with capacities that were unimaginable only five years ago, yet we still need to upgrade on a regular basis. Word processor and spreadsheet applications are exploding in size, and data acquisition software seems to be following this trend. Though bigger may be better in non-real time applications like word processing, size is a handicap in the agile world of real time data acquisition. Therefore, your first measure of the quickness of a real time data acquisition program is its data file size. An application that requires 500 KB of memory should be more efficient than an alternative that needs to slug through 5 MB of code. Since features cost memory, you should factor this in and attempt to balance whistles and bells with performance. Further, many applications will load dynamic link libraries (DLLs). Make sure your measure of data file size includes the application and associated DLLs.
Higher Level Languages Yield Bulkier Code
Computer programming languages adhere to a hierarchy that ranges from the very difficult to the very easy to use. The lowest level and most difficult to use is machine code, the actual 1's and 0's executed by the processor to perform a given task. No one I know programs modern PCs at this tedious and time consuming level.
Next is assembly code which is a kind of shorthand for the machine code level. Processor operations are represented by mnemonics and (usually) hexadecimal codes. Programs written at this level are passed through an assembler to produce the machine code run by the processor. Assembly programs are the most complex to construct and debug, but they produce the most efficient code both in terms of execution time and size. They are the thoroughbreds of the programming hierarchy.
The next step on the programming ladder, carrying us further away from the processor, is a big one: High level languages. Perhaps you've heard of C, BASIC, FORTRAN, or Pascal. These high level languages are the most well known with C and BASIC (including its Windows-based Visual BASIC cousin) emerging as the most popular. But there's a huge difference between the two. C is much closer to the processor than BASIC, and as a result, produces more efficient code in terms of execution time and size.
The final rung on the ladder is occupied by graphical programming languages such as TestPoint, HP VEE, Visual Designer and LabVIEW. Here, the cryptic nature of assembly and even high level programming yields to the graphical manipulation of functional blocks in a highly visual and less arcane environment. The price you pay for this convenience is bulk and the image I described earlier of a processor slugging its way through many megabytes of code. Don't expect to get much in the way of programming efficiencies at this level.
Suitably equipped with the nuances of programming languages, we can finally come to the point: Ask what language was used to program the application you're considering. One programmed in C, with time-critical tasks programmed at the assembly level, all things being equal, will be a far more efficient vehicle than one programmed in Visual BASIC or a graphical programming language.
Change The Way You Think
We are creatures of base 10 and the alphabet. It gives us comfort to know that the files our data acquisition programs create can be displayed, printed and interpreted as easily as reading the morning paper. Unfortunately, base 10 is not the number system of your PC and it doesn't know the difference between A and Z. To achieve high speed real time data acquisition, you have to accept the PC for what it is and work with it on its terms. That means a base 2 number system and binary-coded files. To learn why, lets look at a single sample acquired from a 12-bit data acquisition device.
Computers like to work in groups of bits that are a multiple of 8 (one byte). The 12-bit binary number representing the sample's value fits nicely into a 16-bit word (only 2 bytes) and it's efficient for the PC to write it to disk in this form. But you'd prefer the PC to convert the sample to its ASCII equivalent (one we can read) before writing the value to disk. This simple, seemingly logical request explodes the number of bytes written to disk by at least a factor of 2.5. The range of our 12-bit ADC is 0 to 4095 counts. Writing counts to disk in ASCII-readable form consumes one byte for each character, plus a delimiter (like a comma) for a total of 5 bytes. In the more likely case that you want data stored in meaningful units (like psi), multiplying by m and b scaling constants yields an even larger number of digits that must be written to disk. Your 2-byte binary representation of a single sample could easily explode to 10 or more ASCII characters (bytes). The resulting 5:1 burden will tax your PC and the hard drive and ultimately limit your maximum data acquisition rate.
Here's a hard and fast rule: Real time data acquisition programs that store data to disk as ASCII characters are not high speed solutions. Any well conceived program not only stores data to disk in a two's complement or other non-text, binary format, but will also provide the ability to convert any range of waveform data to ASCII after acquisition.
Advanced Sampling Techniques
The second biggest obstacle to high speed data acquisition, right behind the software itself, is the sluggishness of the hard drive. It's futile to compare the speed of modern processors with hard drives. It's like comparing the speed of light and the speed of sound. Given this contrast, we can conclude that as a data acquisition application becomes less dependent upon the hard drive, the potential for speed increases. There are two advanced sampling methods that can turn this potential into reality: Intelligent oversampling and selectable sample rates per channel.
I described intelligent oversampling (IOS) in detail for an article published in the June, 1997 issue of Sensors Magazine. I won't cover the same ground again here. However, it is worthwhile to state the basic premise of IOS: Any high frequency waveform, when adequately sampled, can be reduced to a single minimum, maximum, or average value which is calculated at precise and equal intervals. These calculated values may be recorded to disk at a significantly slower rate than the waveform was sampled. We've applied this technique in countless applications to not only relieve systems of time-burning disk accesses, but also to dramatically reduce the amount of data actually acquired to disk. The latter benefit can add great efficiencies to subsequent waveform analysis.
Selectable sample rates per channel is another technique designed to minimize both the rate of disk accesses and the quantity of acquired data. Nearly everyone exposed to high speed data acquisition has encountered that one signal that's so much slower than the rest. It's the thermocouple sampled at the same time as vibration. Or oil pressure sampled at the same time as injector signals. Selectable sample rates per channel employs advanced programming that allows you to allocate sample rate on a per channel basis. Without it, you're faced with the pointless alternative of sampling temperature and oil pressure at 10,000 samples per second. The advantages of allocating sample rate per channel can best be described mathematically. Selectable sample rates per channel (using DATAQ Instruments' WinDaq/Pro+ data acquisition software model) adheres to the following general equation:
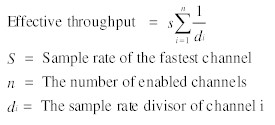
Effective throughput is the rate at which data streams to disk. The sample rate divisor is an integer from 1 to 255 inclusive that may be applied in the manner shown to scale sample rate throughput for the particular channel. Figure 1 shows a dialog box in WinDaq/Pro+ software where the sample rate divisor may be entered for each acquired channel.
Let's apply this formula to the injector and oil pressure example described above assuming two injector signals and one oil pressure signal. The first step determines the rate at which the highest frequency signal must be sampled. This is the value S above. We already assumed this value to be 10,000 samples per second for the injectors. If we further assume sample rate divisors of 1 and 255 for the injector and pressure signals respectively, our effective throughput to disk is:
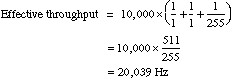
In the absence of selectable sample rates per channel we'd be forced to sample all channels at 10,000 Hz each (30,000 Hz throughput). With it we've reduced throughput and the resultant data file size by 33 percent. That translates to 33 percent less pressure on the weakest link in the high speed data acquisition chain — the hard disk.
The Best Laid Plans?
Even if you follow all the guidelines presented above, you could still find yourself up against an impenetrable high speed limit. It may occur at 10,000 or several hundred thousand samples per second. In such situations, how your data acquisition software reacts is a defining characteristic that is at least as important as speed itself. Perhaps you've used software that simply locks up, displaying (at best) the infamous Windows message "General Protection Fault" and announcing to the world that Windows, the application, or both have gone belly-up. Though the point has been made, you'd most likely prefer a tap on the shoulder over this punch in the gut. Enter the gap detector, a sophisticated software routine that tracks the rates at which the disk buffer fills and empties. Should the former rate exceed the latter, then by definition a gap in the acquired data stream has occurred. This event is displayed directly on the real time display without further disruption of the data acquisition process. Figure 2 shows the gap detector counter built into DATAQ Instruments' WinDaq/Pro+ data acquisition software. The routine displays the number of gaps detected in the data stream so you can judge the severity of the problem (only a handful of gaps in a long test may be inconsequential). Further, the software inserts a commented event marker at the point of each detected gap so their position in the data stream can be determined during playback and analysis.
The Endgame
Data acquisition is not the means to an end. It only sets the stage for your primary goal of waveform analysis and interpretation. Since high speed data acquisition applications nearly always generate large data files, some on the order of many 10's or 100's of megabytes, your waveform evaluation strategy should not be a frivolous afterthought. Don't plan, as so many do, on importing these large files to Microsoft Excel. Excel and other spreadsheets are designed primarily for accounting applications where the quantity of numbers is quite small. Your data files will literally swamp these applications. You need a playback and review application that is the antithesis of your data acquisition applications. Specifically, disk streaming in reverse. Your playback application should handle any data file size and allow you to stream data from a disk file to the display in either a forward or reverse direction. Time compression and expansion are other pluses. With compression you can squash many minutes or hours of acquired data onto a single screen width to provide a bird's eye view of your test. Using expansion, you can select a specific waveform area and expand around it for a closer look. Other useful attributes for a playback package are cursor-based time and amplitude measurements, some statistical and frequency evaluations, and export translators to take specific waveform segments to other applications like Excel for further analysis.
DATAQ Instruments offers such a playback package called the WinDaq Waveform Browser. It is available as a free download from our web site.
Summary
Successful high speed data acquisition has efficiency at its core. You can capture efficiency by applying the fastest computer you can afford to the task. But don't overlook programming and operating efficiencies which the software's designers should build into any product that claims high speed capability. These, more that any thing else, will define success or failure in high speed applications.
Detecting Relay Chatter in Delta Launch Vehicles
Imagine the vibrations you'd encounter as you were launched into space by a rocket. Now imagine how these vibrations can affect on-board control circuits. Since the failure of even one such component during launch can be both costly and tragic, engineers strive to simulate as much of the mission as possible on the ground. One area of particular concern was relay chatter caused by the tremendous vibrations of flight.
A simulation was carried out to determine whether on-board relay assemblies remained closed when subjected to a 70g, 100 Hz to 3 kHz random vibration. Engineers had defined a minimum sample interval of 5 µs with a total data acquisition time of 3 minutes. This translated to a 200,000 Hz sample rate and a data file size of about 72 megabytes. It also precluded use of an older data acquisition product that had a top sample rate of 50,000 Hz. Instead, a small DC current was injected into the relay circuit and connected to a DATAQ Instruments model DI-400 data acquisition card (now obsolete) running under WinDaq/Pro real time software. This combination is capable of sample rates to 500,000 Hz. Any break in the relay circuit caused by vibration would immediately show as a spike on WinDaq/Pro's real time display (Figure 3), thus allowing relay performance to be judged on-the-fly. Subsequent to the test, data files created by WinDaq/Pro can be further interpreted using WinDaq Waveform Browser software. The disk streaming capabilities of both software packages allows data acquisition and analysis independent of data file size.
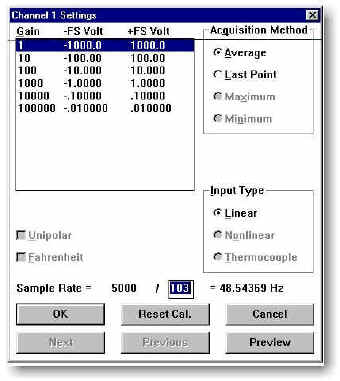
Figure 1 — Sample rate is defined per channel within DATAQ Instruments WinDaq/Pro+ software
by specifying a sample rate divisor for each enabled channel.
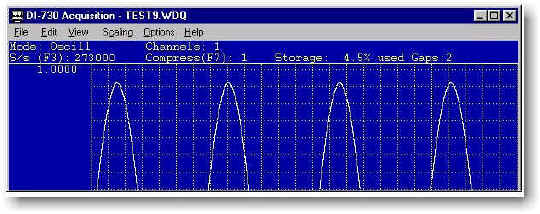
Figure 2 — Software should react in a civilized manner when the maximum acquisition rate is exceeded.
Here, a gap detector built into WinDaq/Pro software displays the number of interruptions in the data stream
recorded to the hard drive. The gap detector helps define the severity of the problem, since only a few gaps
in a data file may be inconsequential.
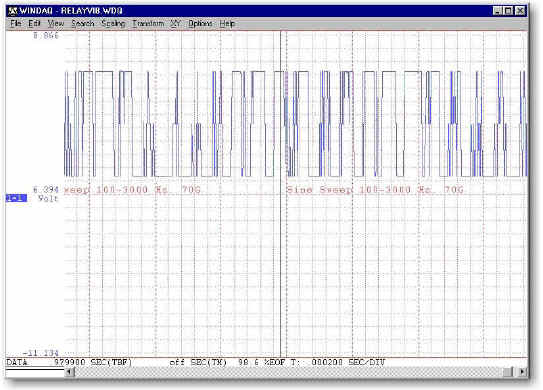
Figure 3 — Relay chatter during rocket launch as simulated by a 100 to 3kHz, 70G vibrator.
This file was acquired at 200,000Hz and streamed to disk for three minutes without interruption.
The result was a 72mb data file, a portion of which is displayed here using WinDaq Waveform Browser
software. Relay chatter, like that shown here, could doom a mission with costly and tragic consequences.