
 View Cart
 sales@dataq.com
 330-668-1444
One of the most common measurements in data acquisition is that of 4-20mA analog signals. Not only are 0-20mA and 4-20mA process current measurements extremely common in industrial settings, but a significant number of flow, pressure and rate sensors also feature 4-20mA outputs.
Why Choose a 4-20mA Output?
Additional Reading:
4-20 mA Shunt Resistor and Current Loop Data Acquisition Products
Acquiring data from sensors/transducer with a voltage output is often impractical in the presence background electrical noise generated by motors, solenoids, switching relays, etc. This is especially true over long distances. The solution is to transmit the sensor/transducer output as a 4-20mA current signal.
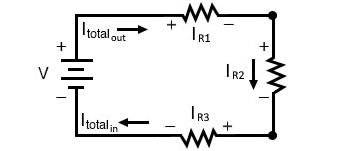
Kirchhoff’s current law states that all current flowing out, must flow back in. So regardless of the length of your signal wires, or the level of background noise, the 4-20mA output will flow through all components in the loop, and will not degrade as a voltage signal would over long distances.
Making a 4-20mA Measurement
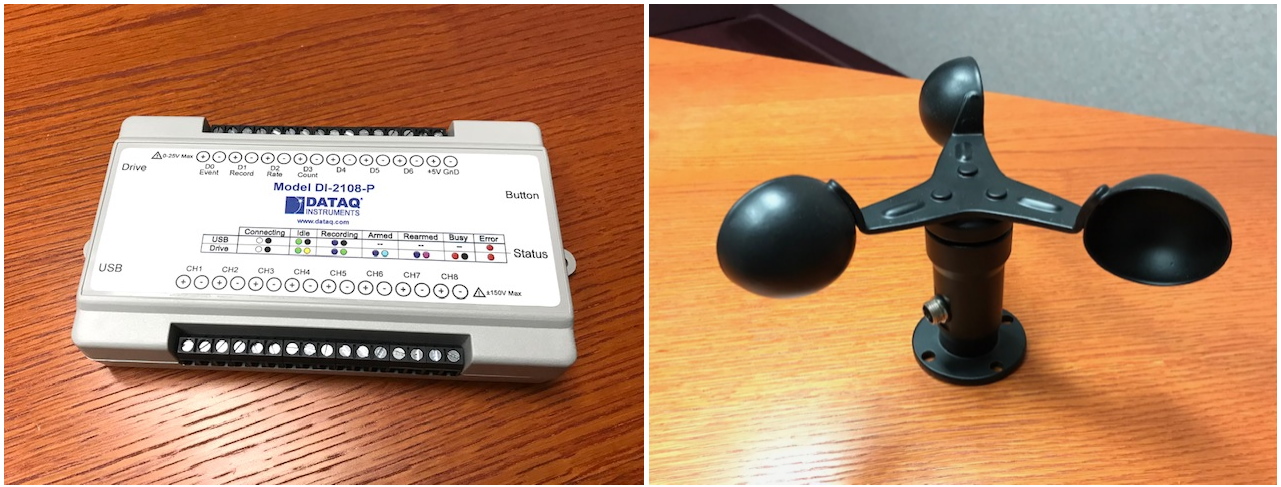
In this demonstration, we’ll acquire and log wind speed data using an off-the-shelf anemometer with a 4-20mA output, a DATAQ Instruments model DI-2108-P and WinDaq data acquisition software.
Because analog voltage data loggers do not acquire current directly, we’ll use a 250 Ohm shunt resistor to convert the 4-20mA signal to 1-5V. The 1-5 volt signal will be directly proportional to wind speed, where 1V = 0 m/s and 5V = 30 m/s (67 mph)
We chose the DI-2108-P because of its programmable 0-5V unipolar measurement range. The unipolar range maximizes the resolution of the measurement. Loggers with bipolar ±5V measurement ranges like the DI-2008 or DI-4108 would also be suitable, albeit with half the resolution.
Connection
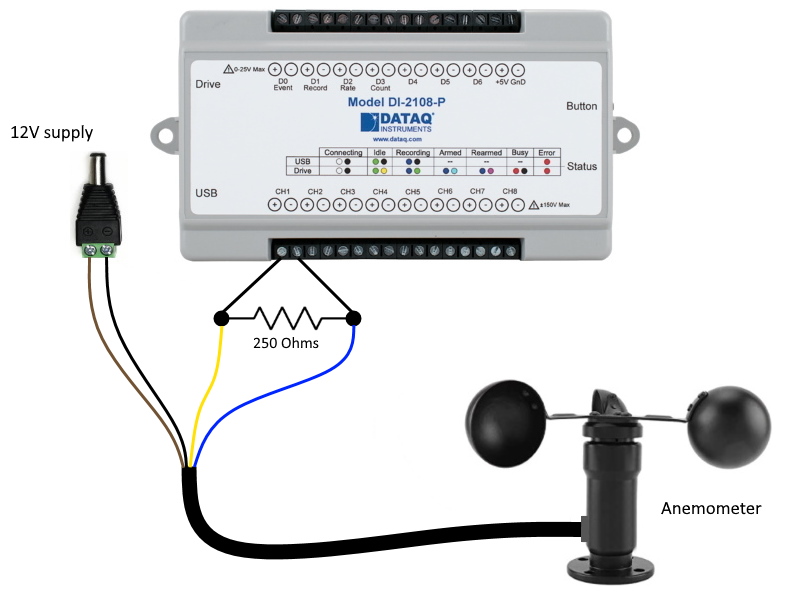
We’ll begin by connecting the 250 Ohm shunt resistor across channel one (+ to -). With the shunt resistor in place, we’ll connect the anemometer to the DI-2108-P. The anemometer has four connections; a positive and negative output, and a positive and negative excitation (supply) connection. We’ll connect the positive output wire (yellow) to the positive (+) terminal of channel one, and the negative output wire (blue) to the negative (-) terminal. This puts the 250 Ohm shunt resistor in the 4-20mA loop, allowing for the 1-5V drop mentioned earlier.
We’ll provide the 12 to 24V necessary to power the anemometer using a 12V DC supply (part #101086). The positive excitation wire (brown) will connect to the positive terminal of the supply, and the negative excitation wire (black) will connect to the negative terminal (as shown below).
Setup and Scaling
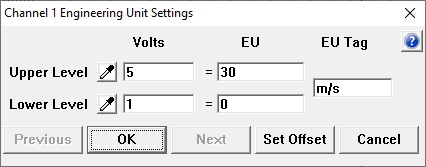
In order to scale WinDaq to display wind speed in meters per second (m/s):
- Choose ‘Engineering Unit Settings’ from the ‘Edit’ pull-down menu.
- Enter 5 for Upper Level > Volts and 30 for Upper Level > EU.
- Enter 1 for Lower Level > Volts and 0 for Lower Level > EU.
- Enter m/s as the EU Tag.
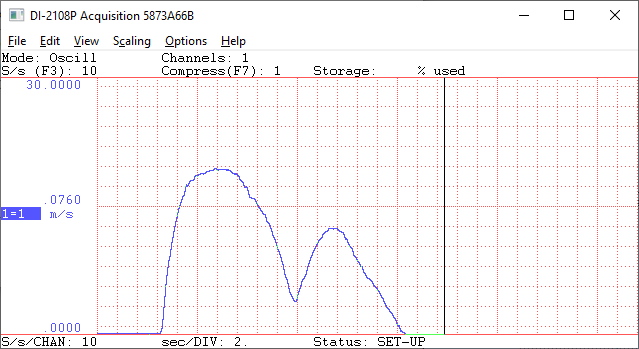
With WinDaq scaled to display wind speed in m/s, placing the anemometer in a breezy environment yields a curve showing the wind speed rise and fall with respect to time, peaking at around 20 m/s in our demonstration.
While the DI-2108-P is best suited for this application with its 0-5V unipolar measurement range, similar products with bipolar measurement ranges like the DI-2108, DI-4108, or DI-4208, or DI-4718B (with a DI-8B32-01 4-20mA module) would also work, albeit with decreased resolution.
This application note demonstrates the ease with which a environmental properties such as wind speed can be digitized, displayed and recorded for analysis using a DATAQ Instruments data acquisition product like the DI-2108-P and accompanying WinDaq data acquisition software.
Follow Us![]()
![]()
![]()
![]()
![]()
![]()
![]()
![]()