
 View Cart
 sales@dataq.com
 330-668-1444
Flow sensors are used to determine the rate at which a liquid flows through a conduit. Whether you are measuring hydraulic fluid through a hose, condenser water in an HVAC system, or the rate and volume of petroleum through a pipeline, flow data is a critical, everyday data acquisition application.
Following up on a previous post outlining pressure measurements using a pressure sensor and a DATAQ Instruments model DI-2108-P, we’ll once again demonstrate how easy it is to digitize and record pressure or flow data for future analysis and review. This time we’ll use a readily available flow sensor with a frequency output that is directly proportional to flow rate, and a DATAQ Instruments model DI-4108-U with WinDaq data acquisition software and the WinDaq Waveform Browser to measure flow rate and calculate flow volume.
As is often the case, there are a number of different DATAQ data acquisition devices that could be used to make this measurement. We chose the DI-4108-U as it’s a general-purpose, off-the-shelf logger featuring a Rate channel with a maximum input frequency up to 50kHz. Depending on whether or not you will be taking other measurements or where you will deploy the device, you may want to choose another model (see the list of compatible devices below).
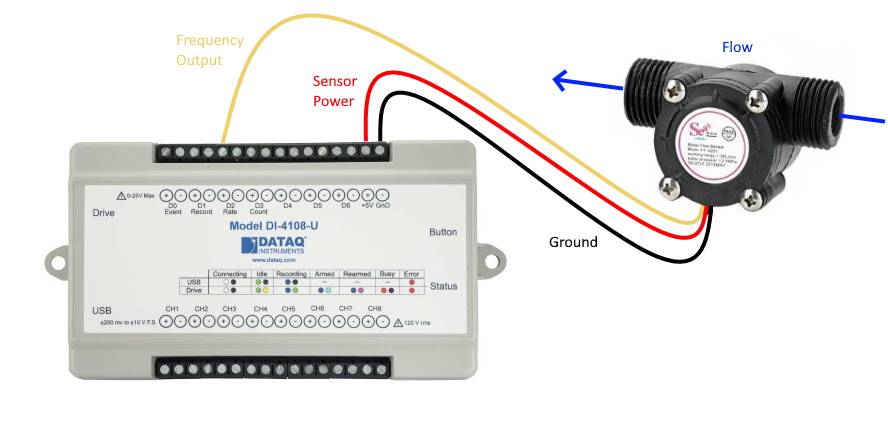
The flow sensor we’re using requires a 5 to 24VDC supply, which will be provided by the DI-4108-U, with a maximum output frequency of approximately 246 Hz over the 1 to 30 L/min (0.5 L/sec) full scale measurement range.
Connection
We’ll start by connecting the flow sensor to the DI-4108-U. The flow sensor has three connections; a frequency output, excitation (supply), and a common/ground connection. In this case we’ll connect the output to the positive (+) terminal of the ‘Rate’ channel (D2), the supply connection to the +5V pin and the ground connection to the GnD pin.
Setup and Scaling
Connect the DI-4108 to your computer and run the WinDaq Dashboard. Choose the DI-4108-U and click the ‘Start WinDaq Software’ button.
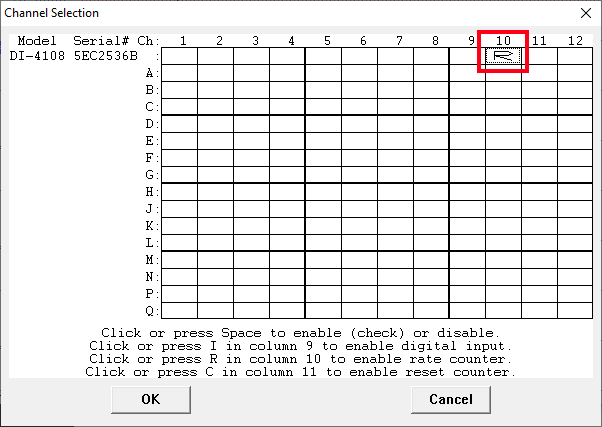
Enable the ‘Rate’ channel in WinDaq: Select ‘Enable Channels’ from the ‘Edit’ pull-down menu and click the channel 10 checkbox.
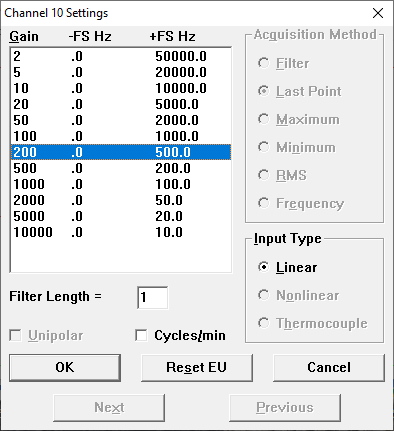
Select ‘Channel Setting’ from the ‘Edit’ pull-down menu. Since the maximum frequency output is just shy of 250 Hz, select a gain of 200 (0-500 Hz measurement range), maximizing the frequency resolution.
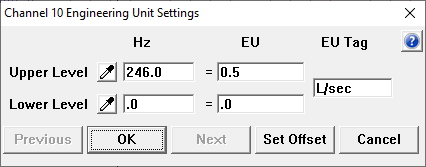
Scale WinDaq to display flow (L/sec) instead of volts:
- Select ‘Engineering Unit Settings’ from the ‘Edit’ pull-down menu.
- Since the pulse output of the flow sensor is 246 Hz at 0.5 litres per second, enter 246 for Hz Upper Level Hz and 0.5 for EU Upper Level.
- For both Lower Levels (Hz and EU) enter 0.
- In this example, we’ll make the EU Tag L/sec.
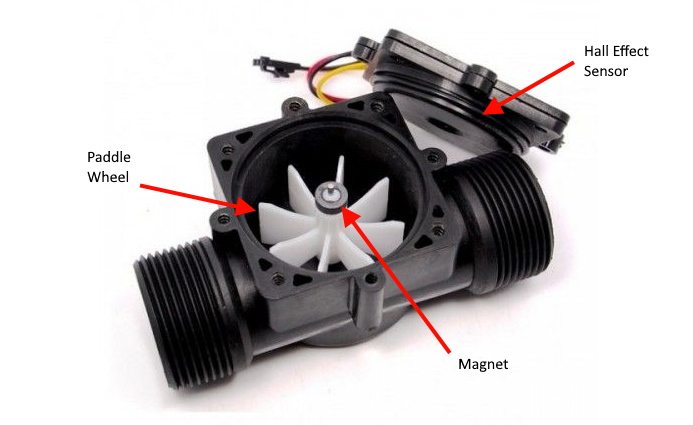
The rotational flow meter used in our demonstration contains a paddle wheel and a hall effect sensor, generating a pulse each time the wheel rotates. The frequency of the pulse output is directly proportional to the rate at which water or some other liquid flows through the meter.
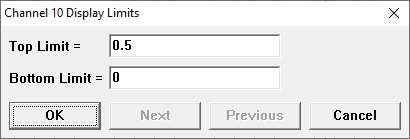
Since the flow meter has a flow range up to 0.5 L/sec, we can optimize the waveform display for that range. Select ‘Limits’ from the ‘Scaling’ pull-down menu and enter ‘0.5’ for the Top Limit, and ‘0’ as the Bottom Limit.
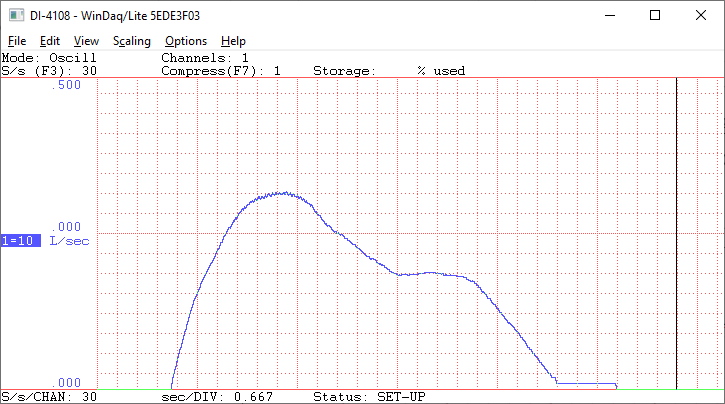
Now that WinDaq is scaled to display flow at a range of 0-0.5 L/sec, allowing flow through the sensor yields a curve, showing flow rate rising and falling with respect to time.
Deriving Total Flow or Flow Volume
With the rate curve acquired using WinDaq Data Acquisition software, we can easily derive total flow, or the total amount of a given substance that has flowed through a conduit. Examples of where this information would be useful include oil flow into a tanker truck, or water into a home or business.
To derive flow volume, we’ll open a file in the WinDaq Waveform Browser containing flow rate data.
Use the Statistics feature in WinDaq Waveform Browser to easily determine total flow (i.e., the area under the flow curve).
- Open your recorded file in the WinDaq Waveform Browser.
- Click and hold the left mouse button in the annotation area at the bottom of the Browser window. This allows you to reposition the cursor, moving it left or right.
- Move the cursor to the beginning of the curve, and enable a time marker (Options>>Enable Time Marker).
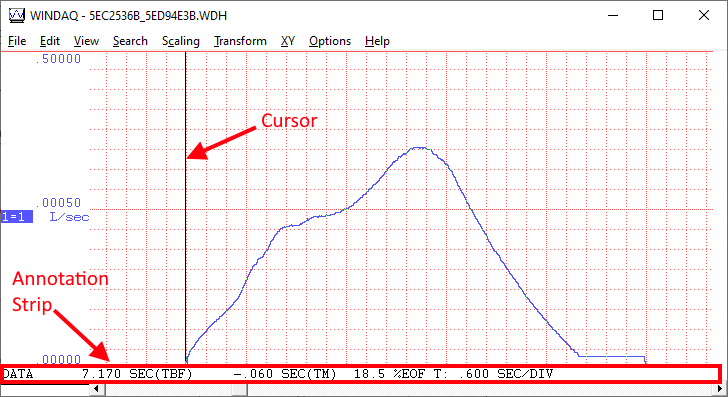
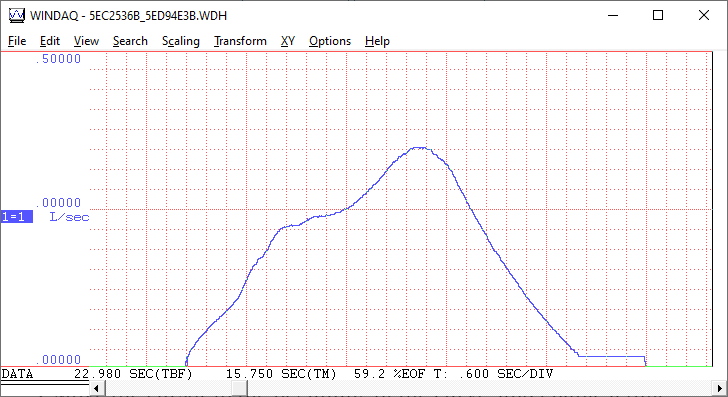
- Move the cursor to the end of the flow curve (do not insert another time marker). The time marker and cursor mark the boundaries of the flow curve to determine total flow.
- Select ‘Statistics’ from the ‘View’ pull-down menu.
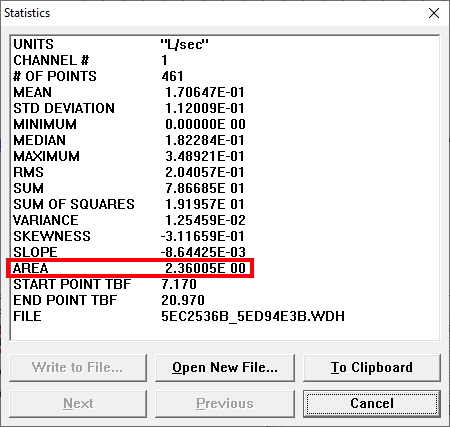
As you can see, the Statistics window displays the area under the curve. So we know that 2.36 litres flowed through the conduit over the chosen time span (between the time marker and cursor).
Other compatible devices that include a designated “Rate” channel:
Follow Us![]()
![]()
![]()
![]()
![]()
![]()
![]()
![]()
3 Comments
osvaldo hernandez
Hello, we have a power hydraulics workshop and we use two turbine flow meters, a 6000psi max pressure gauge and we measure temperature. The question is if you can help us digitize the information sensed, even if you do not provide turbine pick-up. pressure sensor and thermos, hopefully they have information thanks
Daqhelper
Hello Osvaldo,
Based on the signal output of the turbine flow meters, and the type of sensor being used to acquire temperature (thermocouple, RTD, etc.), we could recommend a data acquisition system to acquire the data.
Please forward this information to sales@dataq.com
Regards,
Shawn MacDonald
Application Engineer
DATAQ Instruments Inc.
Suben
Looking for buy flow meter with data logger.
Flow is clean cement grout with density 1.5g/l