
 View Cart
 sales@dataq.com
 330-668-1444
When acquiring and analyzing data, it’s often useful to isolate a particular event, or area of interest. When dealing with very large data files, containing days, weeks or even months of data, this may seem like a daunting task.
In this application note, we’ll demonstrate the ability in the WinDaq Waveform Browser, using the ‘Time Marker’ and ‘Cursor’, to isolate a segment of data, analyze it and even save it as a separate data file altogether.
What is the Time Marker? The Cursor?
As the name implies, in the WinDaq Waveform Browser, the ‘Time Marker’ can be used to mark a particular instant in a data file (to determine elapsed time or the number of data points between events), or to mark one boundary when selecting a segment of data. You’ll find the ‘Enable Time Marker’ option in the ‘Options’ pull-down menu. You can also use the F4 shortcut key to enable a time marker.
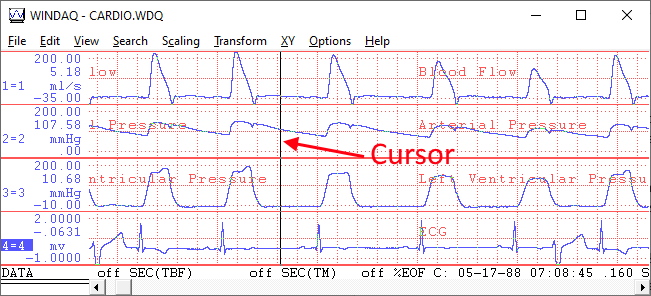
The ’Cursor’ is the black vertical line that runs from the top to the bottom of the screen. The ‘Cursor’ can be used to determine the value and/or date & time and any particular instant. In addition, the ‘Cursor’ can also be used to mark a second boundary when selecting a segment of data to analyze, export or save.
Positioning the Cursor and Enabling a Time Marker
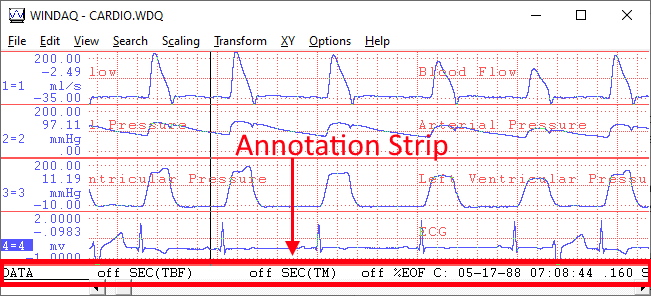
With a file open in the WinDaq Waveform Browser, you can position the ‘Cursor’ by clicking and holding down the left mouse button in the annotation strip at the bottom of the Waveform Browser window (as shown below).
With the ‘Cursor’ positioning at the beginning of the segment of data that you’d like to analyze, export or save, choose ‘Enable Time Marker’ from the ‘Options’ pull-down menu. Next, position the ‘Cursor’ at the end of the segment you’re interested in. Don’t insert another time marker, just drop it there.
Options Once a Segment is Selected
With a segment of data selected, you can perform some rudimentary analysis, save the data in another format (CSV, for example), or save it as a separate WinDaq data file.
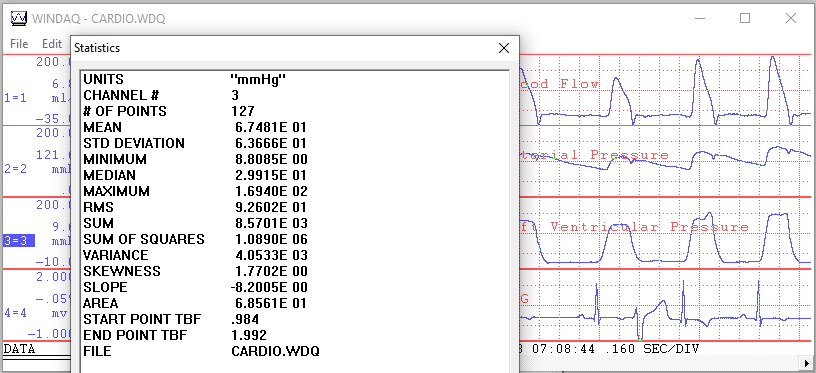
To perform some basic analysis, and display values like standard deviation, minimum, maximum, etc., choose ‘Statistics’ from the ‘View’ pull-down menu.
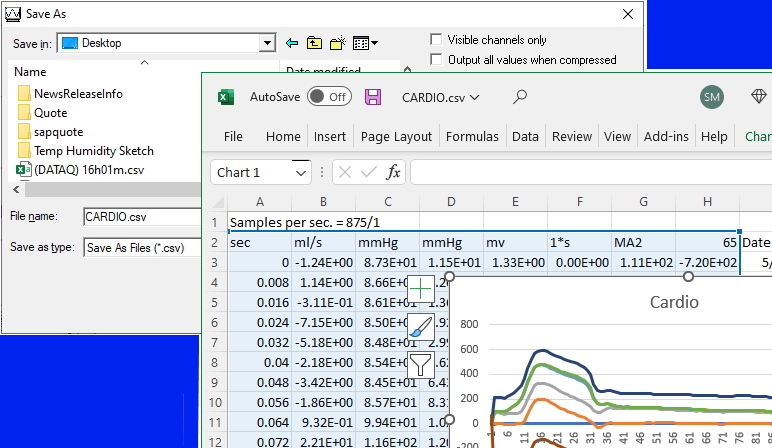
To save data in CSV format for viewing and analysis in Microsoft Excel, choose ‘Save As’ from the ‘File’ pull-down menu, choose the “Spreadsheet Print” format and end the file name in a .csv extension (as shown below).
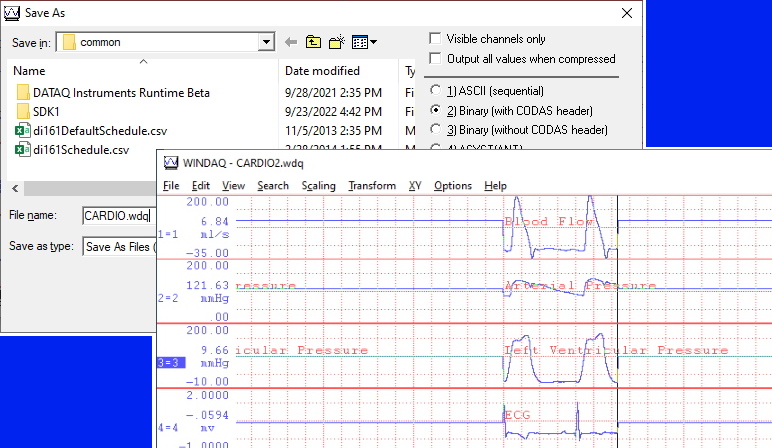
To save the segment as a new WinDaq file, containing only the area of interest, choose ‘Save As from the ‘File’ pull-down menu select the “Binary (with CODAS header)” format, and end the file with a .wdq (or .wdc) extension (as shown below).
Additional Reading:
Data Acquisition in Microsoft Excel – How to Import Recorded Data
Save a Segment of Data as a Second, Smaller File
FFT (Fast Fourier Transform) Waveform Analysis
Follow Us![]()
![]()
![]()
![]()
![]()
![]()
![]()
![]()